It Looks Clever So It Must Be Clever
One of the interesting things about the world of trading is that so much has changed, but in reality, so little has changed. The basic principles of trading have remained unchanged since we first started swapping coloured pebbles with one another.
Most importantly, the psychology of trading hasn’t changed and probably never will, simply because populations are incapable of change. Individuals are capable of change, but populations are not.
The environment in which we conduct trading has changed dramatically, and this is a function of technological change. Technology has changed rapidly, particularly over the past two decades. In the days when the world was in black and white, if you wanted to produce a chart or a piece of analysis, it required an enormous amount of actual physical work. If I wanted to look at the performance of an instrument over a given time frame, I would have to source the data for that instrument, which generally meant going to the library and finding a physical paper source of data. Then, collecting that data and entering it into a very primitive analysis programme, such as the old Quattro Pro, and then attempting to wrestle that into some form of coherent output.
All of this was labour-intensive and often required quite high-level skills to achieve anything worthwhile. I found that what usually happened was I would get partway through a project and decide that it was just too friggen hard.
This is not an issue for traders nowadays; it’s quite possible to generate all forms of analysis simply by pushing a few buttons. The physical barrier to analysis has been removed. The unfortunate thing about that is that there is no longer a break on analysis; as such, there is a number of spurious pieces of rubbish floating around the Internet that pass for serious analysis.
In any form of data analysis for trading, the primary question we need to ask is simply, ” Is the outcome of my analysis actionable? Or am I merely generating some form of intellectual decoration that is designed to make me feel clever and hopefully convince others that I’m also clever?
The problem nowadays is that whilst we are drowning in data, most of which is meaningless, we are as far away from actual wisdom as ever. As an example, consider the chart below.
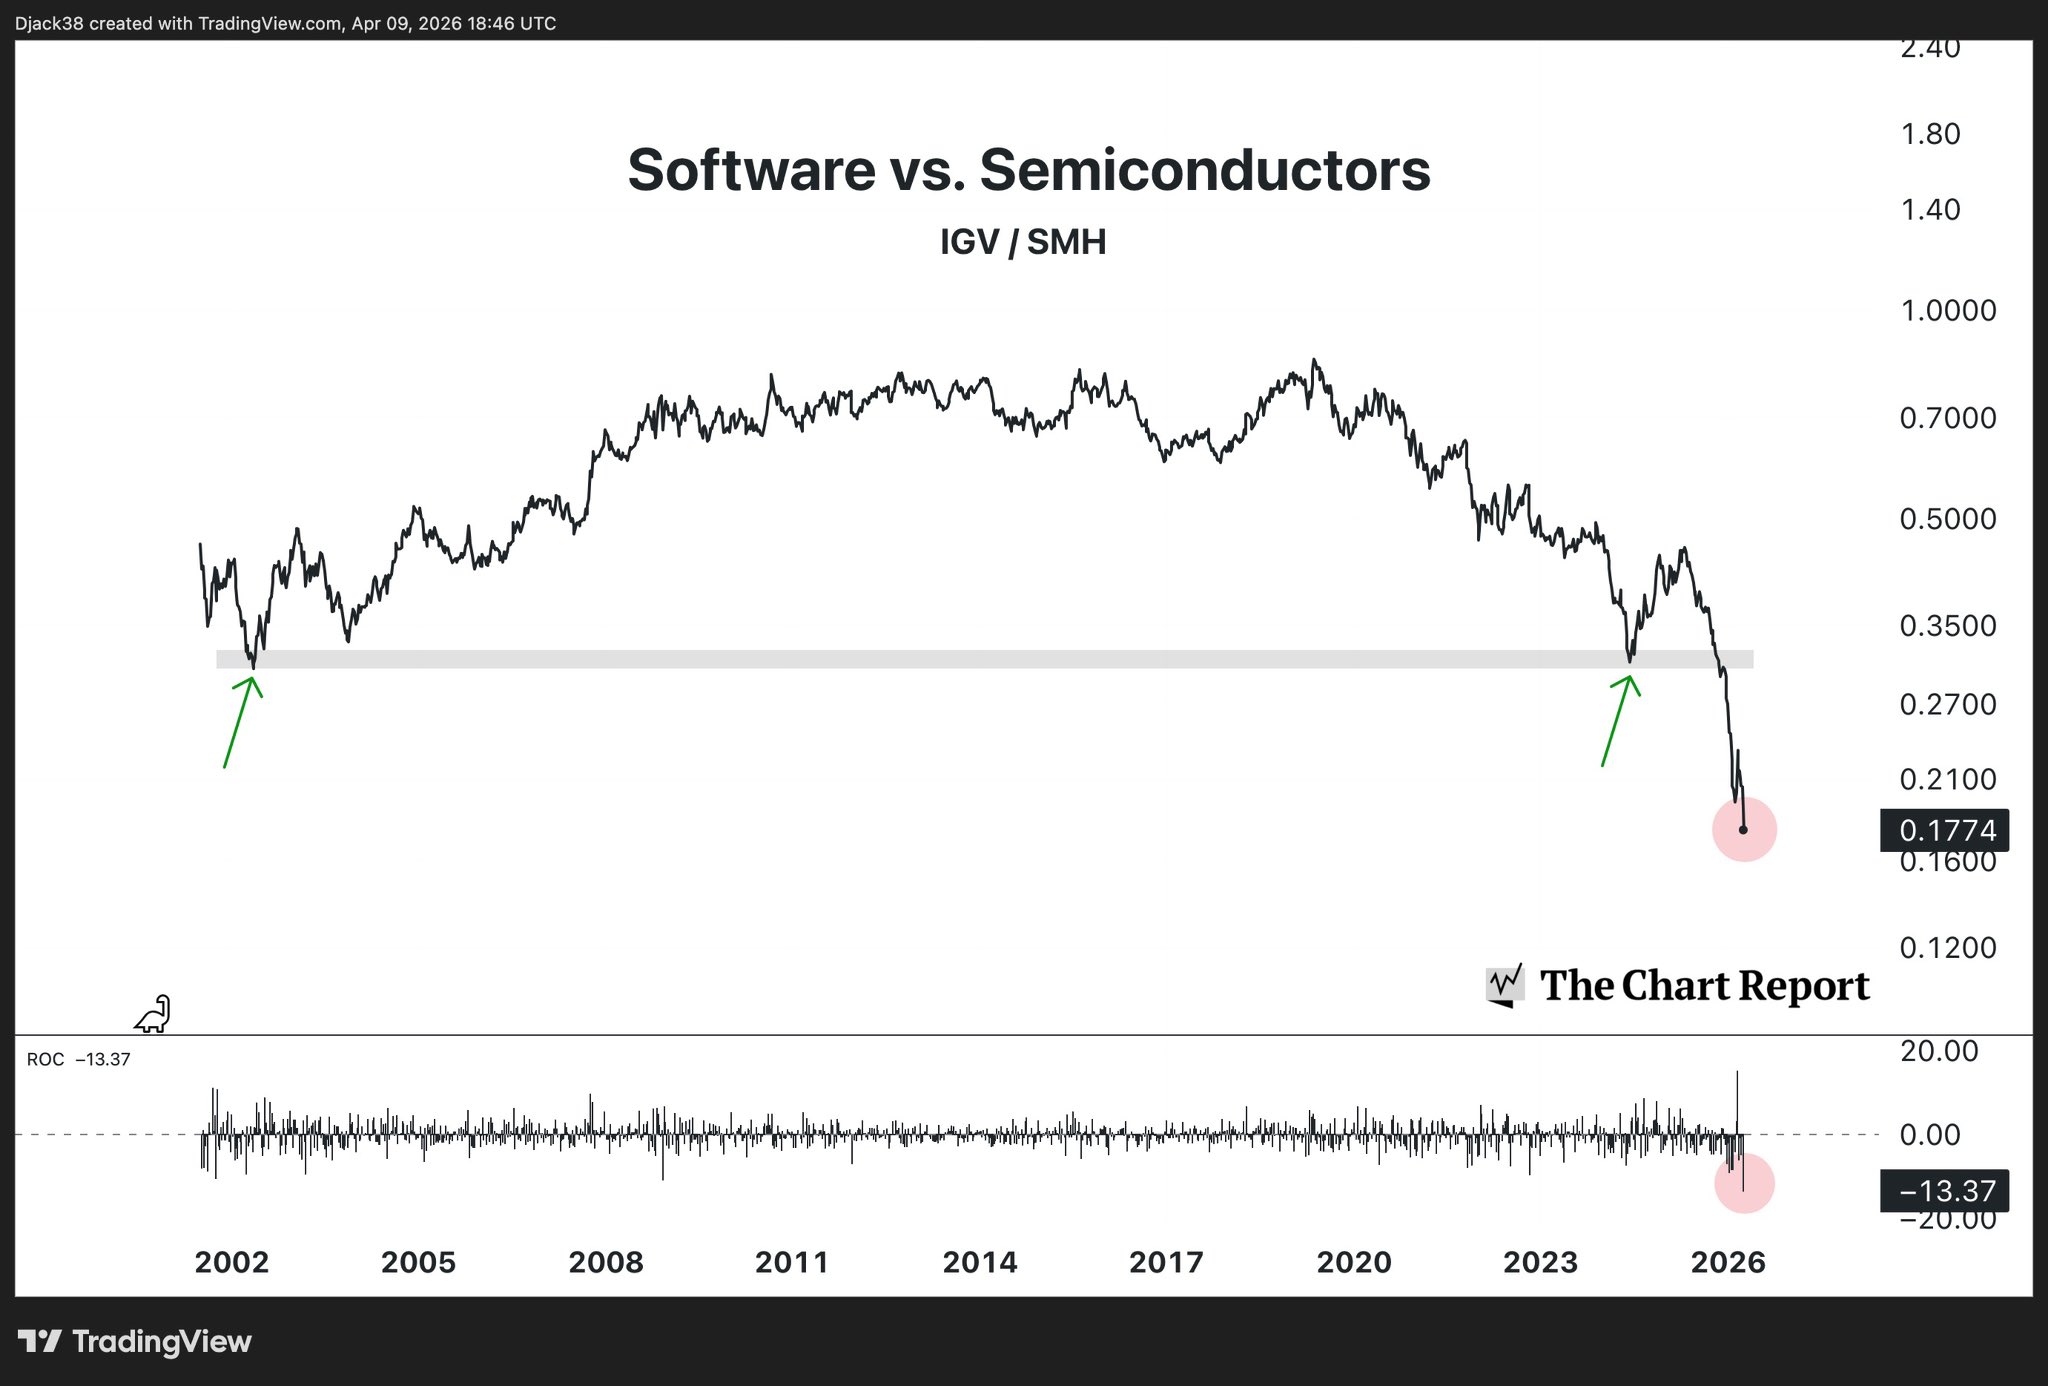
Charts such as the one presented—comparing software versus semiconductor performance through a ratio like IGV/SMH—create the appearance of insight. They are clean, structured, and persuasive. Yet beneath the surface lies a fundamental problem: they offer data without context, and, as we know, trading is all about context.
From my perspective, this is not an analysis. It is a decoration. It is something to present in hopes of getting a bit of ego stroking, then walk away from.
At the base level of the data–information–knowledge–wisdom hierarchy, raw numbers hold no inherent value. A ratio rising or falling tells us only that one thing is outperforming another. It does not tell us why, nor does it provide a framework for what should happen next. Without causality, without a mechanism, and without a repeatable edge, such charts exist in isolation—detached from the decision-making process they are often mistakenly used to justify.
The human mind, however, is deeply uncomfortable with randomness. Faced with a chart, we instinctively impose narrative. A breakdown becomes “rotation into cyclicals.” A rally becomes “growth reasserting dominance.” These explanations are retrofitted after the fact, providing emotional comfort rather than predictive power. In reality, the chart itself contains none of this meaning. It is simply a visual representation of relative price movement—nothing more, nothing less.
Correlation, particularly in markets, is notoriously unstable. Relationships that appear robust over one period often dissolve without warning. The IGV/SMH ratio may have respected a level historically, as the chart suggests, but this “respect” is observational rather than structural. There is no underlying force ensuring that software must outperform semiconductors at a given ratio level. There is no economic law anchoring that relationship. It is a coincidence of flows, positioning, and transient narratives—factors that are themselves constantly shifting.
To treat such levels as meaningful is to confuse coincidence with causality.
More critically, these types of charts fail the most important test in trading: actionability. What, precisely, is the trade? Does a bounce at the shaded level imply buying software, shorting semiconductors, or both? Where is the risk defined? What invalidates the view? Without clear answers to these questions, the chart remains an intellectual curiosity rather than a tool for execution.
The question you always need to ask yourself is: Is my observation actionable? Can it help me make money? If not, then it is little more than an intellectual exercise.
Ultimately, the appeal of such charts is psychological. They offer the illusion of depth without the burden of rigour. They allow the observer to feel informed without being accountable to a process. But markets are indifferent to narrative and unforgiving of imprecision.