This audit was completed and signed off by a Registered Company Auditor, which is the highest level of auditor in Australia. Not only does this provide peace of mind for you, but it also goes a long way towards showing you that our methods and record-keeping have been independently verified.
Our equity systems switch themselves of in times of high volatility and move to cash. At the same time the All Ordinaries suffered a drawdown of 55%. So whilst the average return for index funds was negative this basic Mentor Program system was positive.
When the system was running at full speed its average return was over 30% pa. And in 2011 its return was over double that of the market’s return. Bench-marking against the All-Ords provides context for the trading activities.
We teach that there are some times to trade equities, & other times to be in cash. This makes sense. Plus, it allows you to switch to other markets during these times as well.
Plus the maximum drawdown on the system was 3.9% compared to the markets 55%. So this is a substantial comfort, especially when people are trading their Superannuation equity. Lots of traders who haven’t don’t the Mentor Program lost even more than 55%. I even know of one trader, aged 69, who lost 70% of their Super. It’s hard to get it back when you’re 69, isn’t it.
All trading involves risk. Leveraged trading has large potential rewards but also involves taking on the possibility of large potential risk. Be aware and accept this risk before trading. Educate yourself so that you can quantify your risk prior to entering any position in the markets. Always think of the worst case scenario and never trade with money you cannot afford to lose. All forecasting is based on statistics derived from past performance and past performance is no guarantee of future results. The past cannot be completely duplicated and be aware that there are no “safe” or “no loss” trading methods. No-one or no company can ever guarantee profits or freedom from loss. No representation is being made that any account will achieve profits or losses similar to those discussed.
On this website are some comments from attendees and customers of Louise Bedford’s and Chris Tate’s events and other programs. These comments are not typical and may vary from individual to individual. Each individual’s success comes from many factors including a dedication to implementing the programs and products that we teach and provide. The income statements or comments are not intended to represent any form of guarantee or guarantee that every person will achieve the same results. There is no guarantee of achieving the same results and you recognise that any business or trading endeavour has inherent risks for loss of income or capital.
The testimonials shown on this website accurately show some comments from attendees and customers of Louise Bedford and Chris Tate’s events and other programs. These comments are not typical and may vary from individual to individual. Each individual’s success comes from many factors including a dedication to implementing the programs and products that we teach and provide. The income statements or comments are not intended to represent any form of guarantee or guarantee that every person will achieve the same results. There is no guarantee of achieving the same results and you recognise that any business or trading endeavour has inherent risks for loss of income or capital.
Testimonials are potentially non-representative of all clients. Your trading results may vary from those case studies detailed on this website and in any event held by anyone associated with this website. Trading Game is not a broker of licensed to provide anything other than general advice. Your actions and the results of your actions in regard to anything you receive from this or related entities including but not limited to Trading Game, Trading Secrets, The Art of Trading, TG Trading Floor, or any associate company or individual are entirely your own responsibility. We cannot and will not assume liability for any losses that may be incurred by the use of any information received and any such liability is hereby expressly disclaimed.
The Trading Game encourage participants to test and adapt the learning from all programs, products and services to suit their own trading style, and encourage all individuals to test the components to satisfy themselves that the trading methods meet their needs. Measurement of subsequent results and continual adjustments to suit current conditions are encouraged to be written down and discussed with independent financial advisors. Working to a written trading plan that is tested, measured and adjusted is an essential component of effective trading and this is strongly emphasised and recommended.
There is no guarantee that, even with the best advice available, you will become a successful trader because not everyone has the personal attributes required to become a successful trader. Education may make you the best trader that you, personally can be, but this is no guarantee that you will be profitable. It is our goal to help you understand the intricacies of the market, but by no means are we suggesting that we are giving you a complete and full guide to all of the risks and all of the difficulties you may encounter as a trader. The trading strategies discussed may be unsuitable for you depending upon your specific investment objectives and financial position. You must make your own investment decisions in light of your own investment objectives, risk profile and circumstances. Use independent advisors or ‘second opinions’ as you believe to be necessary. Therefore, the information provided on this website and in any representations made by any individual or company on this website, or in any function, seminar or video, or written testimonial in any way is not intended to be specific advice as to whether you should engage in a particular trading strategy or buy, sell or hold any financial product. Margin requirements, tax considerations, commissions and other transaction costs may significantly affect the economic consequences of the trading strategies or transactions discussed and you should review such requirements with your own legal, tax and financial advisors. Before engaging in such trading activities, you should understand the nature and extent of your rights and obligations and be aware of the risks involved.
According to information provided by Wiley, Louise Bedford and Chris Tate’s publishing house, as well as several other independent bookshops, Louise and Chris are both considered to be bestselling authors. This information may however, be out of date, flawed in some way, or inaccurate. Justification, provided by Wiley our publisher in an official capacity has been sought and provided with documentation available on request.
General Advice Warning:
The information on this website is of a general nature and does not take into account your objectives, financial situation or needs. Before acting on any of the information you should consider its appropriateness, having regard to your own objectives, financial situation and needs.
Hypothetical Disclaimer:
All results are considered to by Hypothetical unless otherwise specified. Hypothetical performance results have many inherent limitations. Unlike an actual performance record, simulated results do not represent actual trading. Also, since the trades have not actually been executed, the results may have under or over compensated for the impact of any uncertain market conditions such as lack of liquidity. No representation is being made that any account will or is likely to achieve profits or losses similar to those shown on this or any other related website. In fact, there are frequently sharp differences between hypothetical performance results and the actual results subsequently achieved by any particular trading program. Furthermore, only risk capital should be used for leveraged trading due to the high risk of loss involved. One of the limitations of hypothetical performance results is that they are generally prepared with the benefit of hindsight. In addition, hypothetical trading does not involve financial risk and no hypothetical trading record can completely account for the impact of financial risk in actual trading. For example, the ability to withstand losses (and incur account drawdowns) or to adhere to a particular trading program in spite of trading loses are important issues which can also adversely affect actual trading results. There are numerous other factors related to the markets in general or to the implementation of any specific trading program, method or system, which cannot be completely taken into consideration with hypothetical performance results and will affect trading results and you profit and loss. Traders who have undertaken our trading have lost money. You need to be aware of this, accept responsibility for your own education and results, and quantify the risks to see if this is something you can resolve in your own mind.
We are in the process of compiling results from a hypothetical trading methodology to add to the website.
Risk in action
Risk is ever present in markets, it is an essential feature of all financial markets. As such it can never be removed only managed. An extension of this is that there is no such thing as a risk free trade, all trading carries with it the possibility of loss.
Risk presents itself to the trader as the possibility of losses – all traders at some stage in their career will have both single losses and groups of losses known as clusters. These groups of losses present themselves as a drawdown in the traders equity. This drawdown if not managed properly can be catastrophic to the trader and result in the total loss of all trading capital.
To better understand how drawdowns occur and how they influence the value of an account consider the chart below.
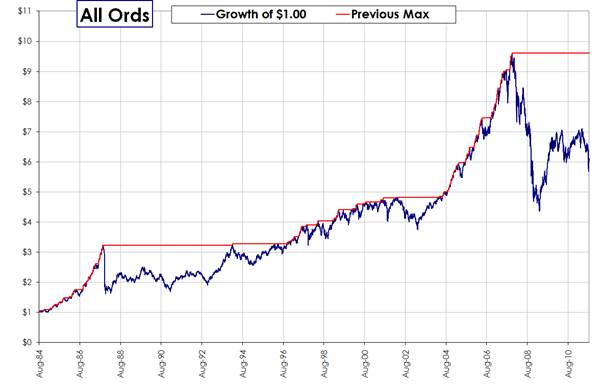
This is a chart of the growth of $1 dollar invested in the All Ordinaries Index from 1984 to the present day. You can see that there are periods where the peak equity represented by the red line climbed and periods where is went flat as the index fell away. At present you can see that the value of the index is well below its peak as markets struggle with the aftermath of the GFC. This drop away from the peak equity is known as a drawdown and the drawdown curve of this particular approach can be represented as follows.
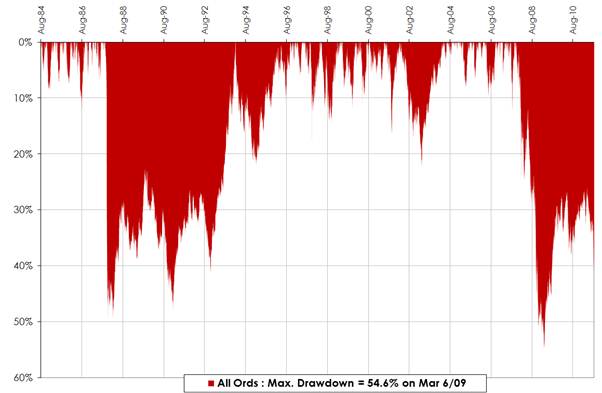
This style of chart is known as an underwater equity chart and it tracks the drops in the equity of a given trading system. For example imagine you had a portfolio that tracked the All Ordinaries index. This graph would tell you how far your account had fallen and how long it had fallen for. For example if you headed into the GFC with this portfolio you could expect that your maximum drawdown on March 6th 2009 was 54.6%. That is if your tracking portfolio had been worth $100,000 at the peak of its equity as shown by our first chart it would now be worth $46,400.
All trading systems even those used by professionals suffer from drawdown. For example the chart below is from Abraham Capital a well known managed futures trend follower.
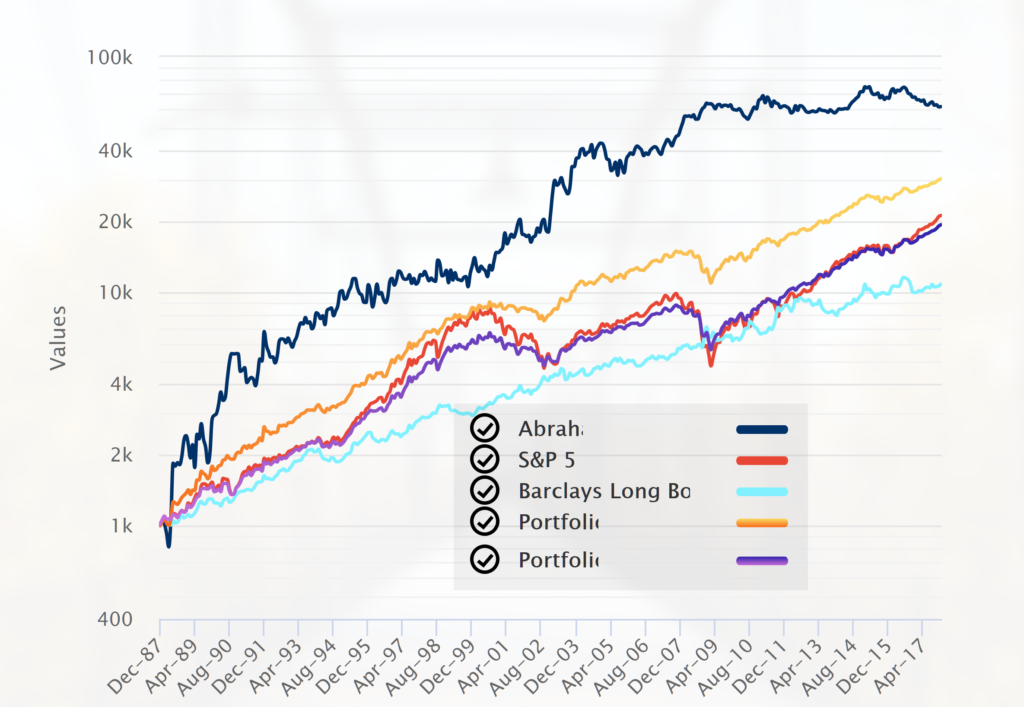
You can see that the curve is not a straight line but rather has peaks and troughs. Equity rises and equity falls.
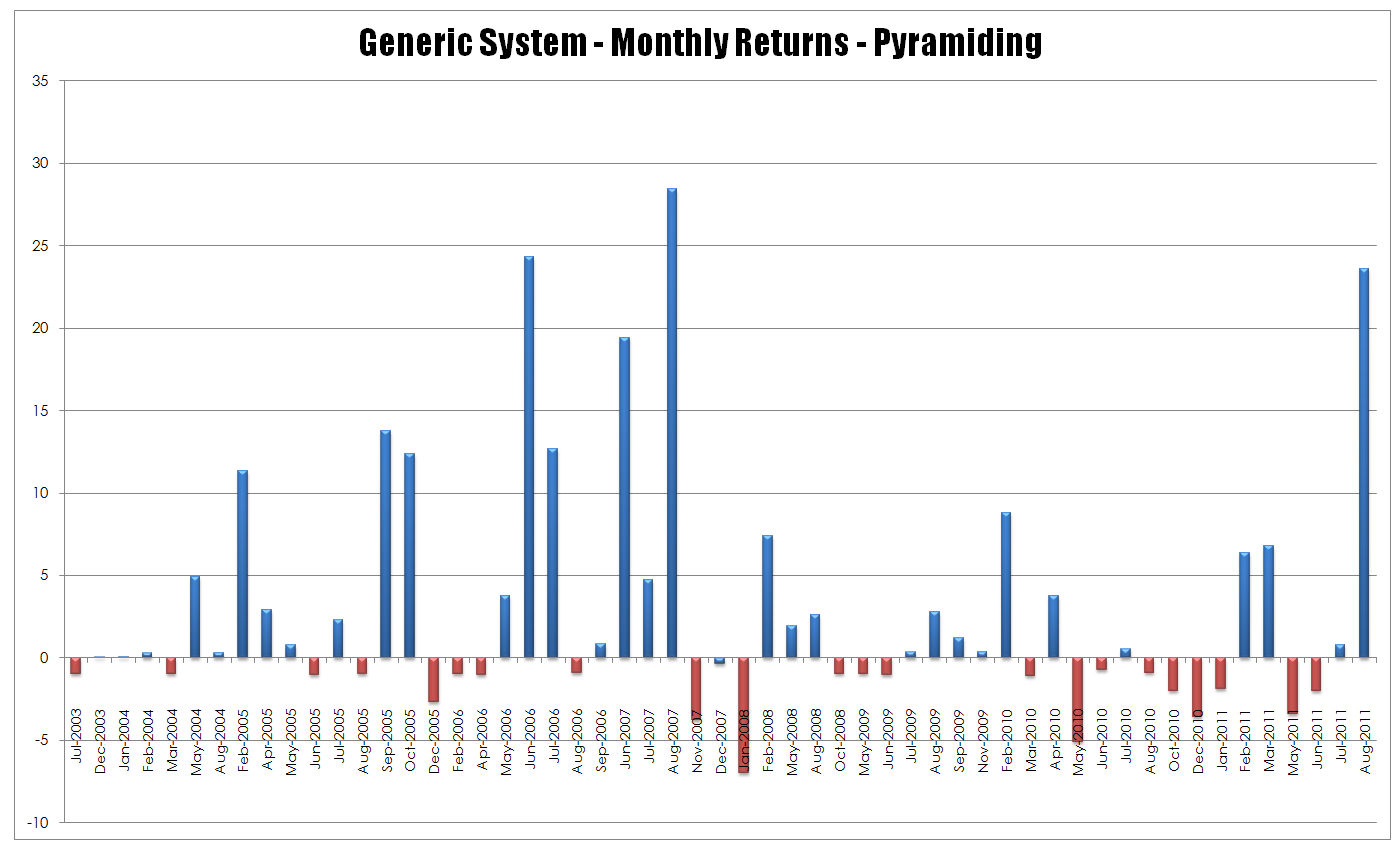
These results can be further broken down by looking at the monthly returns for the fund. You can see that not all months are positive and that losing periods occur.
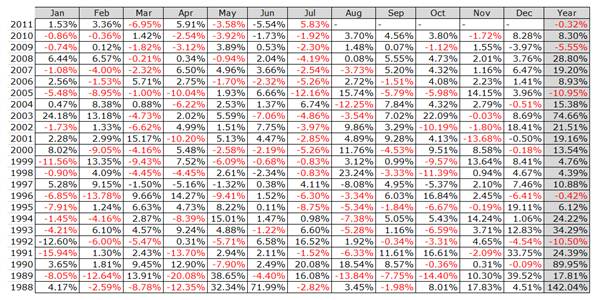
This pattern is repeated with all money managers irrespective of the style of trader or the market they trade. If someone tells you that they have no losing periods they are simply being dishonest. Periods of losses are inevitable for traders and investors.
It is possible to look at risk with more depth and the following discussion is more academic in nature and looks at sources of risk for traders and investors.
The moment we enter a financial market and make an investment, we are automatically exposed to two forms of risk. The first is avoidable risk – this is any form of risk which can be avoided and does not result in a reduction in potential performance. For example if I decided not to trade an illiquid market, I would be engaging in a form of avoidable risk reduction. The same case could be made for not using derivative markets when I have an incomplete understanding of them. I have made a decision that reduces my risk but does not impact upon my potential performance.
The second form of risk is unavoidable risk. Any form of unavoidable risk reduction will result in a reduction in the potential for performance. This is a little bit hard to understand initially but it becomes clearer when we look at the two main components of unavoidable risk – controllable risk and uncontrollable risk.
Controllable risk is what traders traditionally refer to as risk. This is the amount that is risked on each trade when it is initiated. Uncontrollable risk is simply those things we can never know until after they occur. These include things such as political upheaval, terrorism or the US banking system going face first into the mud because having an MBA apparently means you don’t understand that lending all the money you have to people who don’t have a job is a bad thing.
The key component here is the notion of a reduction in performance that flows from these two types of unavoidable risk. As said, this is hard to understand but it becomes clearer when we break these issues down into their components.
With regard to controllable risk, we have a narrow threshold of permissible risk that allows us to effectively risk manage our performance. If we risk too little then our performance is meaningless. For example, risking 0.1% on a trade would render most trades too small to be viable whereas risking 1% would make most trades viable and would result in a higher performance. Speculation must be worth the effort and it must be worth the effort when compared to alternative investment vehicles. We can see that excessive attempts at reducing this form of risk will lead to a drop off in potential performance. There is also a second side to this equation that everyone should be familiar with and that is risking too much is also detrimental to performance simply because losses build at an uncontrollable rate. It cannot be stressed too highly increasing your risk amount does not automatically translate into higher gains. There is an efficient threshold of risk beyond which total loss of capital is guaranteed. Prudence wins, reckless aggression results in disaster.
With regard to uncontrollable risk, or those things we cannot know, the only way to deal with these is to simply avoid trading all together. It is easy to see how this would affect our results since our potential return would be zero.
Once we enter the market, we also have some very subtle additional sources of functional risk that we have to understand and deal with and I have listed these below.
Time – the longer we are in the market the greater the probability of a move against us. This can seem a bit confusing but think of it simply as trends coming to an end. Whilst trends can last for extended periods, they eventually end. We have to accept that they do eventually end and to be prepared for this event. All too often traders are seemingly blind to changes in the market. Granted this blindness is generally related to either an incomplete system of a series of biases with regard to market direction but these reasons do not negate the fact that trends end.
Diversification – this is a very difficult concept for people to grasp. It is often thought that if your shares have different names then you are diversified. Unfortunately this is a somewhat simplistic view of the process of diversification then you are diversified. This is a very unsophisticated answer since true diversification is very difficult within a closed equity market such as Australia. A truly diversified portfolio might have a structure similar to this –
1. USD Index or $A Spot
2. Crude
3. Heating Oil
4. Soybeans
5. Coffee
6. High Grade Copper
7. Platinum
8. Palladium
9. Eurodollar
The interesting thing with diversification within closed equity markets is that the more diversified you are – that is the more instruments you own the more your performance will drop. This occurs because you begin to replicate the underlying index, once this replication takes place you will never be able to outperform the index
Liquidity – traders, particularly those with a fundamental bias, often treat trading as if it were a treasure hunt with the aim being to find things before anyone else does. This often leads to the purchasing of extremely low liquidity instruments at what are perceived to be bargain basement prices. The problem with this logic is twofold. Firstly, if no one else wants it, why do you, and secondly, how are you going to convince anyone else of the value of your purchase? In addition to these problems, a lack of liquidity leads to a lack of price discovery, which in turns leads to increased volatility and an inability to exit the instrument in a hurry.
Bid-Ask Spread – at any given time there might be 110 ASX stocks that have exchange traded options available to the trader. Many of these are household names such as BHP, RIO, WBC and NAB. However, many are not, and for some obscure reason (perhaps related to the notion of trading as a treasure hunt) traders insist on trading issues such as IPL, JHX and ORI, which have miniscule turnover.
The problem here is twofold. Firstly, the ASX allows these stocks to be listed, and secondly, a tiny band of traders want to try and trade them. Any optionable stock outside the top 10 by volume has very little turnover and the trader is at the mercy of the market maker. Note I said market maker singular. Most of these stocks only have one market maker, not several, such as with the more liquid stocks. As a result the bid-ask spread, whilst constrained by ASX guidelines, will usually be at its maximum because there is no one else there to provide price discovery.
Mentor Program Specific Information
The prime aim of the Mentor Program is to equip traders with the skills necessary to navigate their way through the maze of financial markets. The cornerstone of this is the ability to design effective and robust methodologies to cope with changing markets. Inherent within this is the need to instil in traders the need to manage the risks that dealing in particularly leveraged instruments present.
Our approach is very much one of there are old traders and there are bold traders – there are no old bold traders. A failure to accept and manage risk is often at the heart of all trader failures. This maxim applies to both the highly sophisticated and the Mum and Dad retiree. Failing to understand the risks of the instruments you are dealing with along with unrealistic expectations is a potentially disastrous combination.
The design of a trading system that is robust and efficient is generally a long and arduous process for traders. However, within the Mentor Program we have been able to short cut this process by introducing traders to long used techniques and by ruthlessly removing any idea that we consider to be detrimental to the survivor of the trader .
The statistics presented on this page represent an archetypal system that has been designed by members of the Mentor Program for the trading of equities within a conservative portfolio.
General Testing Conditions
System One
| Initial Capital |
$100,000 |
| Risk Per Trade |
1% |
| Portfolio Heat |
20 open trades |
| Pyramiding |
No |
| Portfolio |
ASX 300 |
| Start Date |
02/05/2003 |
| Last Date |
27/05/2011 |
| Exit Method |
ATR multiple stop |
| Exit Value |
Lowest price on signal day |
Survivor Bias
This testing was conducted over the ASX 300 on 12/08/2011. This raises the question of survivorship bias, where by definition the current constituents have survived over the period in question and may or may not have been included in the ASX 300 over the entire period of the backtest.
Conversely, the list excludes stocks that have now been delisted that have performed quite well over the period in question. Some examples include HIH, ABC learning, Babcock & Brown etc all experienced significant upwards trends before their fall from grace.
The overall impact of survivor bias upon the testing is that there will be a slight upward drift in the returns achieved.
Slippage & Brokerage
Brokerage was not included in the testing regime. The decision not to include was made for two reasons. Firstly, the widely disparate rates of brokerage paid by various traders. Brokerage payable ranged from $19.95 to $69.95. Secondly the number of trades taken by the system is very small, hence brokerage is not a major impost upon the profitability of a the trading system.
| Stats at a Glance |
| Profit/Loss Stats |
| Profit Status: |
PROFITABLE
|
| Starting Capital: |
$100,000.00
|
| Finishing Capital: |
$307,491.63
|
| Maximum Equity/(Date-Time): |
$207,491.63
|
(9/08/2011)
|
| Minimum Equity/(Date-Time): |
-$2,536.91
|
(14/05/2004)
|
| Gross Trade Profit: |
$280,787.51
|
280.79%
|
| Gross Trade Loss: |
-$73,295.88
|
(-73.30%)
|
| Total Net Profit: |
$207,491.63
|
207.49%
|
| Average Profit per Trade: |
$1,430.98
|
| Profit Factor: |
3.8309
|
| Profit Index: |
73.90%
|
| Annualized Rate of Return |
14.54%
|
As can be seen by the above metrics the system was profitable over the time frame that was tested.
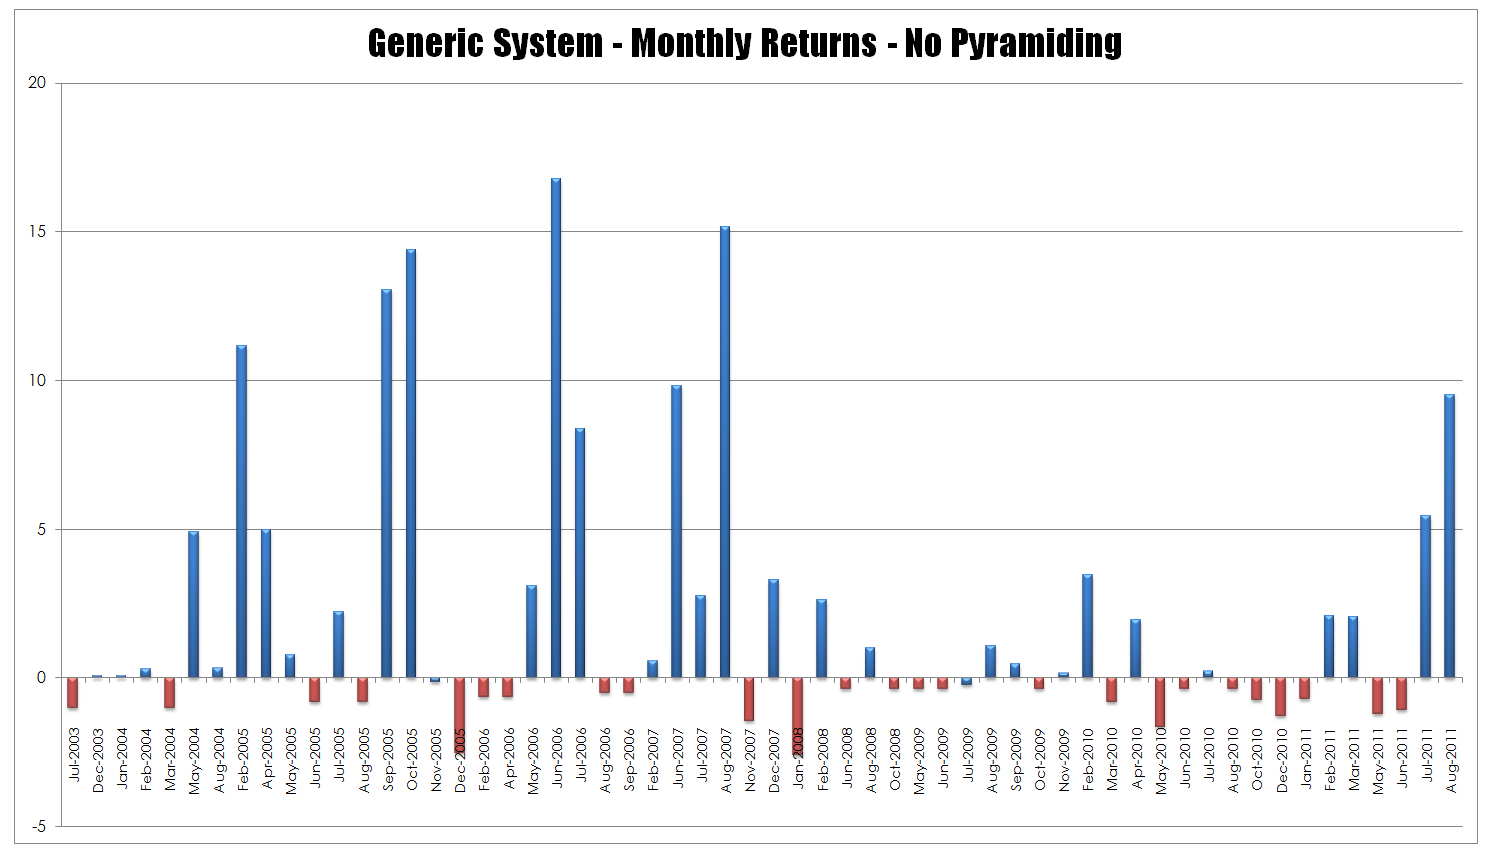
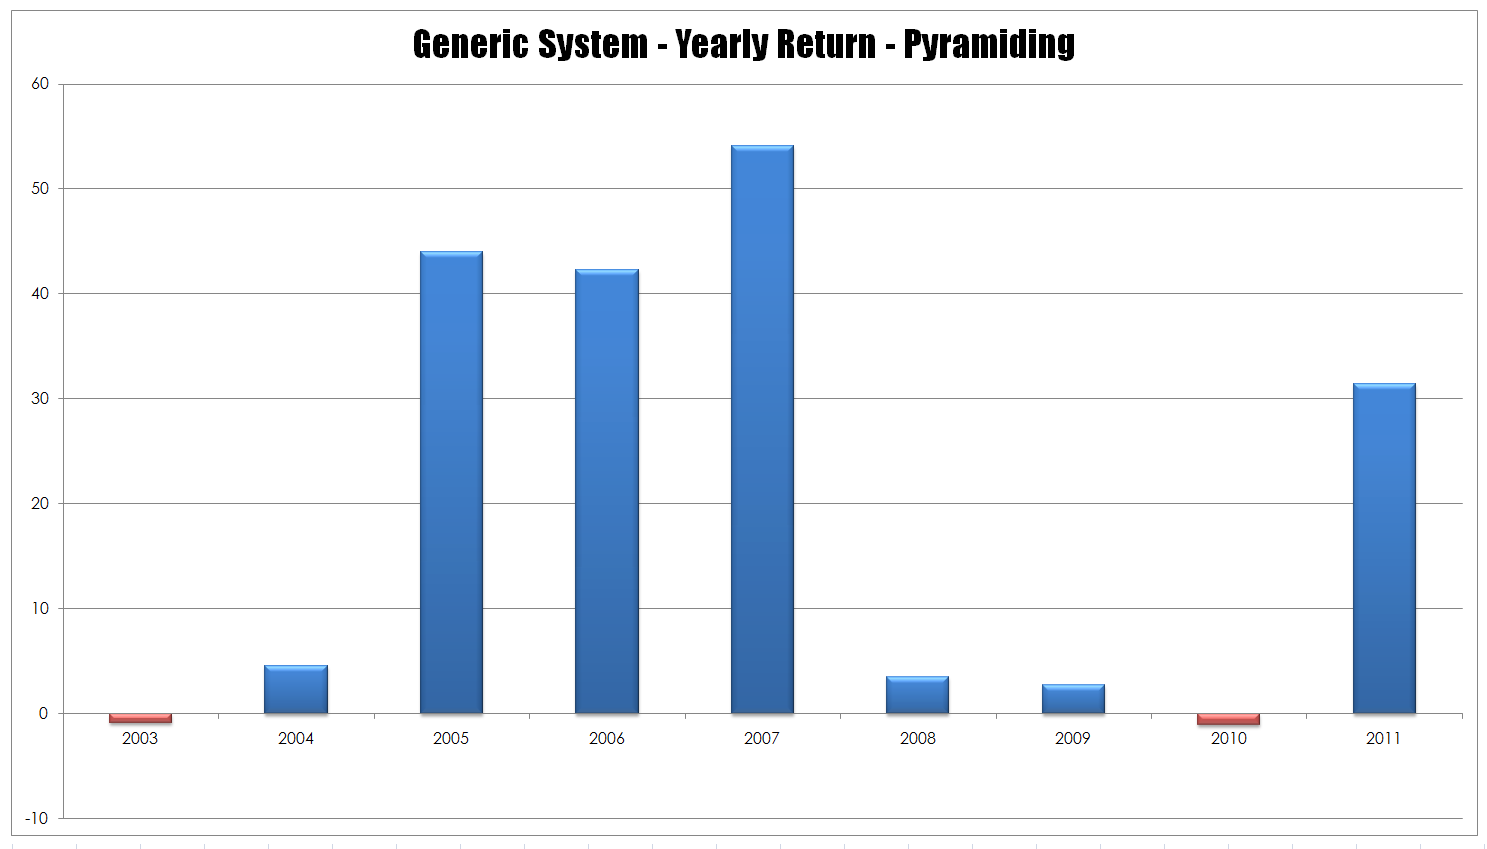
This profitability can be further explored by breaking the trading results down into yearly and monthly returns to gain an idea of how the profits in the system were distributed.
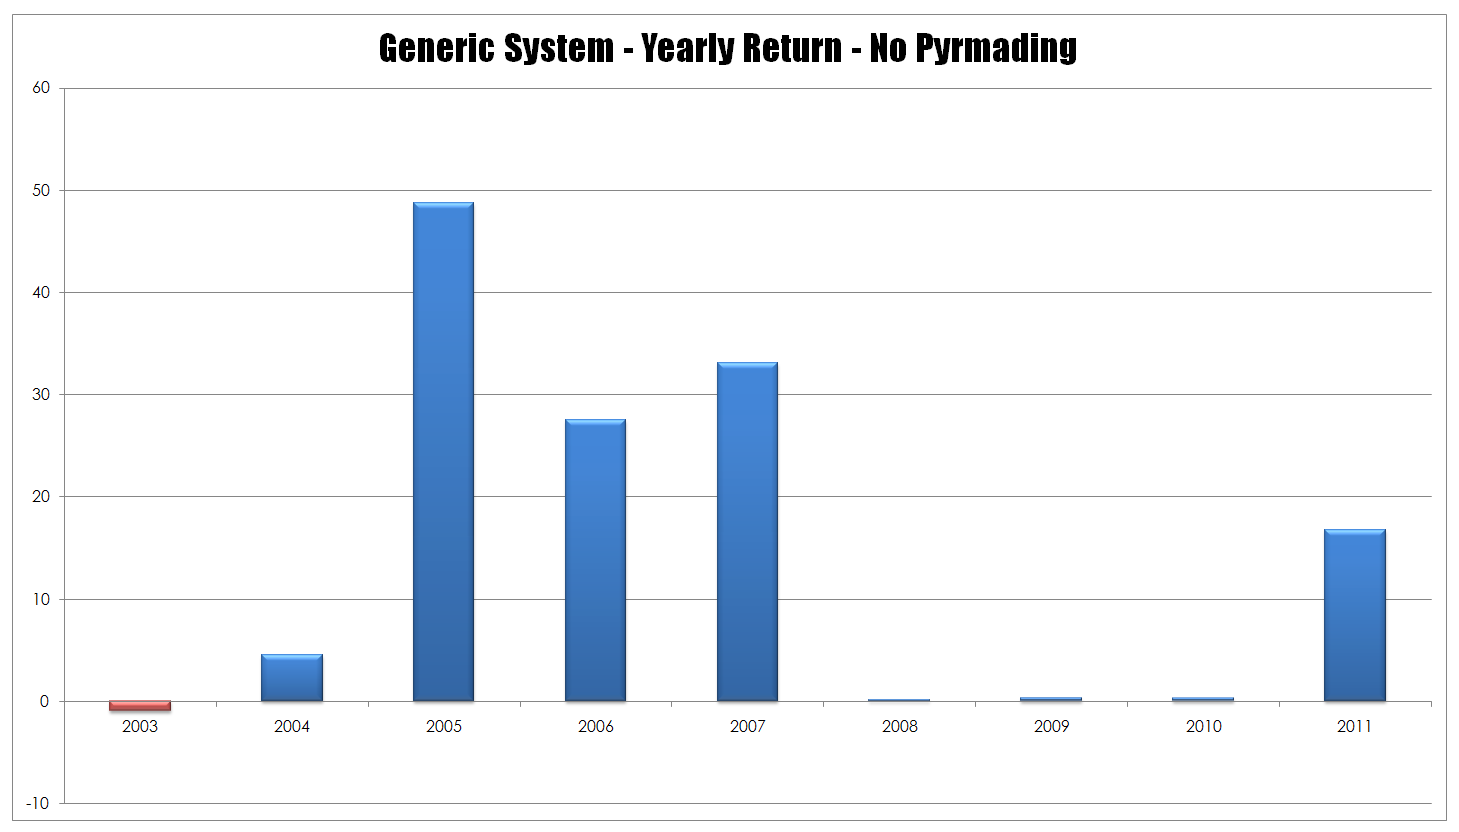
As can be seen this system was profitable in all years with the exception of the first year. This loss in the first year is an important phenomena in systems testing since it demonstrates that the system is taking its losses very quickly. This taking of losses leads to what is known as drawdown which has been discussed in depth in this part of the web site (insert risk discussion hyperlink)
The drawdown statistics for this system are as follows.
| Relative $ Drawdown Stats |
| Maximum Dollar Drawdown: |
$8,288.25
|
| Average Dollar Drawdown: |
$1,391.96
|
| Relative % Drawdown Stats |
| Maximum Percentage Drawdown: |
3.94%
|
| Average Percentage Drawdown: |
0.60%
|
| Peak to Valley $ Drawdown Stats |
| Maximum Dollar Drawdown: |
$13,224.25
|
| Capital Peak: |
$274,767.90
|
| Capital Valley: |
$261,543.65
|
| Peak to Valley % Drawdown Stats |
| Maximum Percentage Drawdown: |
4.81%
|
| Capital Peak: |
$274,767.90
|
| Capital Valley: |
$261,543.65
|
The important points to note about this summary of the systems drawdown are.
1. The dollar value of the peak to valley drawdown was $13,224.25
2. The percentage size of the peak to valley drawdown was 4.81%
This indicates that the system has good risk control as losses are not allowed to get out of hand.
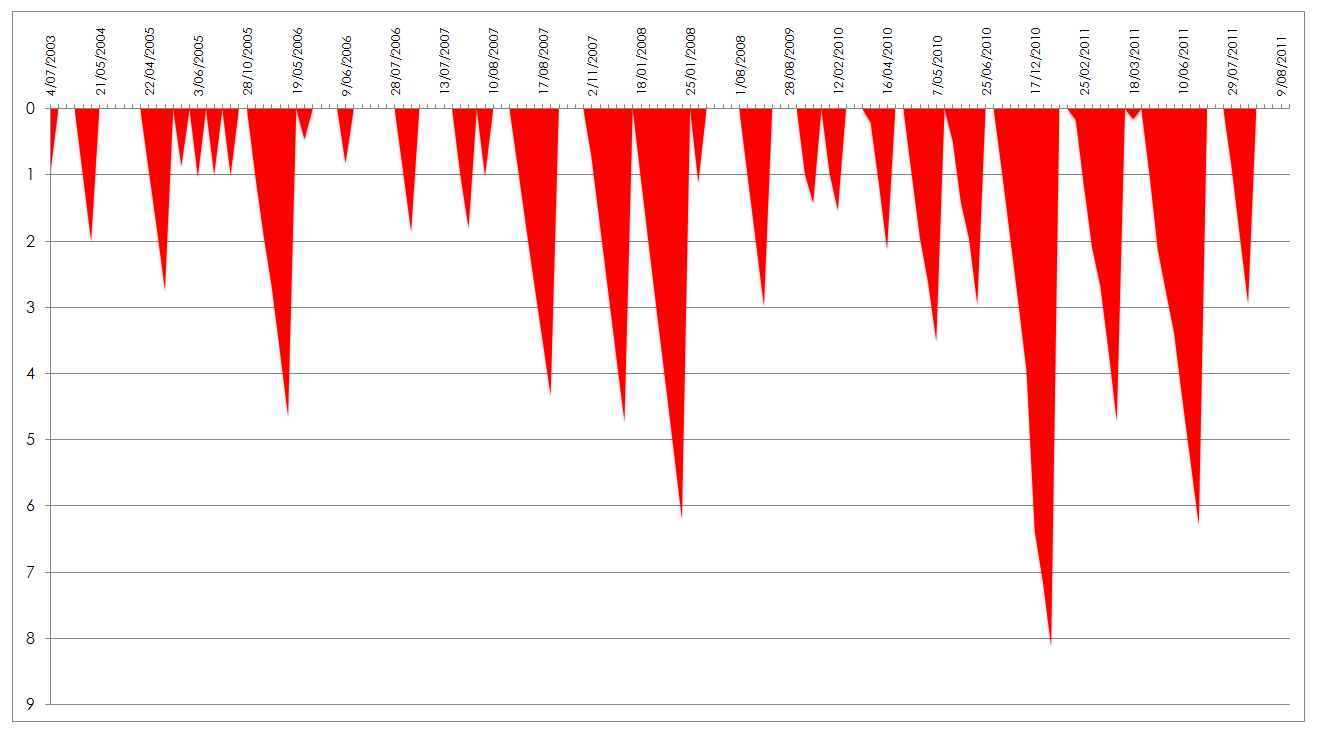
These results yielded the following underwater equity curve.
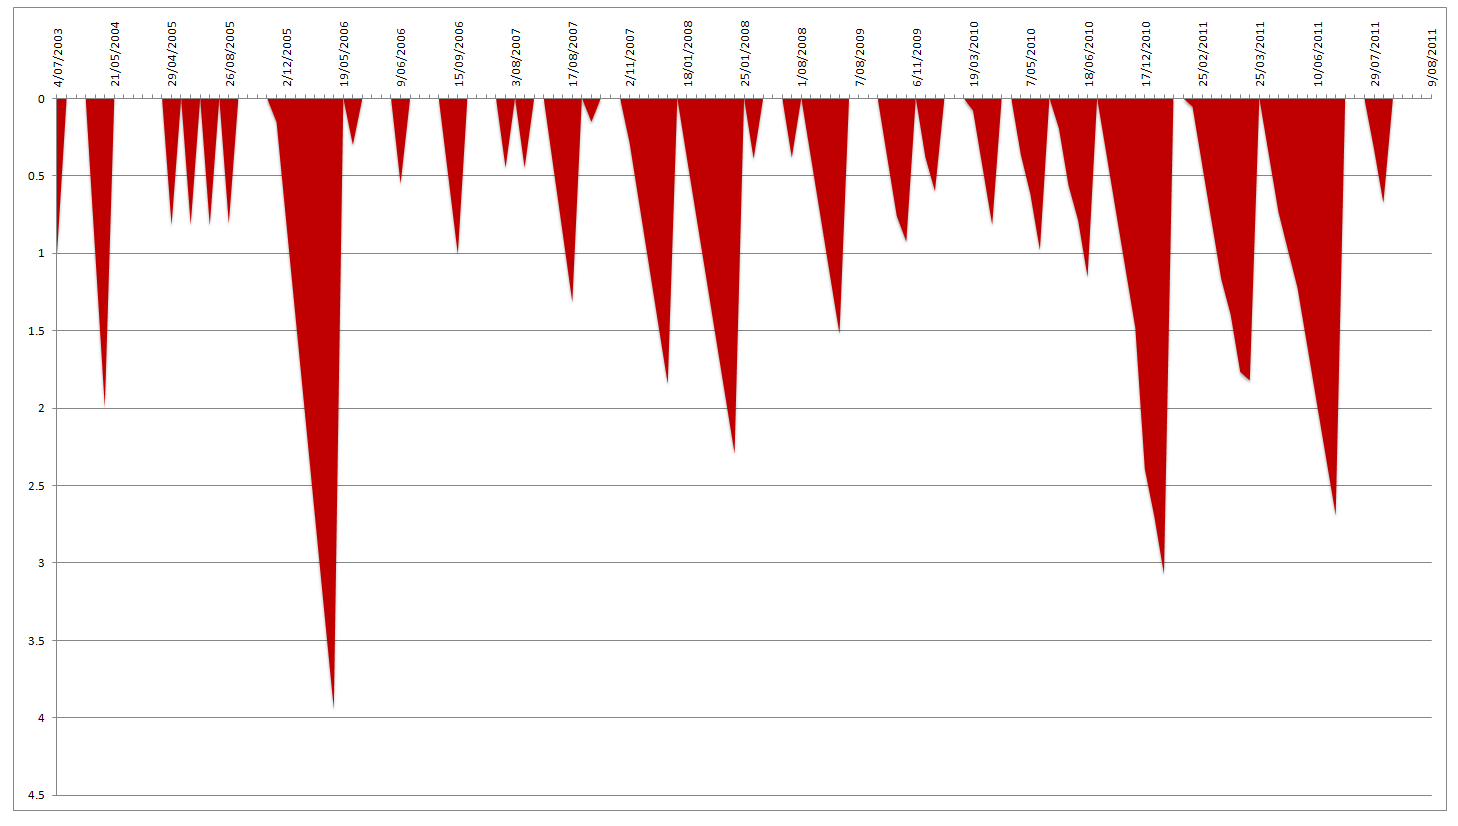
In assessing the suitability for trading too often traders are overly concerned with how the system may make them without considering the journey that the system took to achieve those results. As an extreme example most traders could not tolerate a system that returned 50% pa if each year it could be expected to drawdown 60%. This would be a very difficult system to stick with. It is for this reason that traders should consider the underwater equity curve when looking at the systems returns.
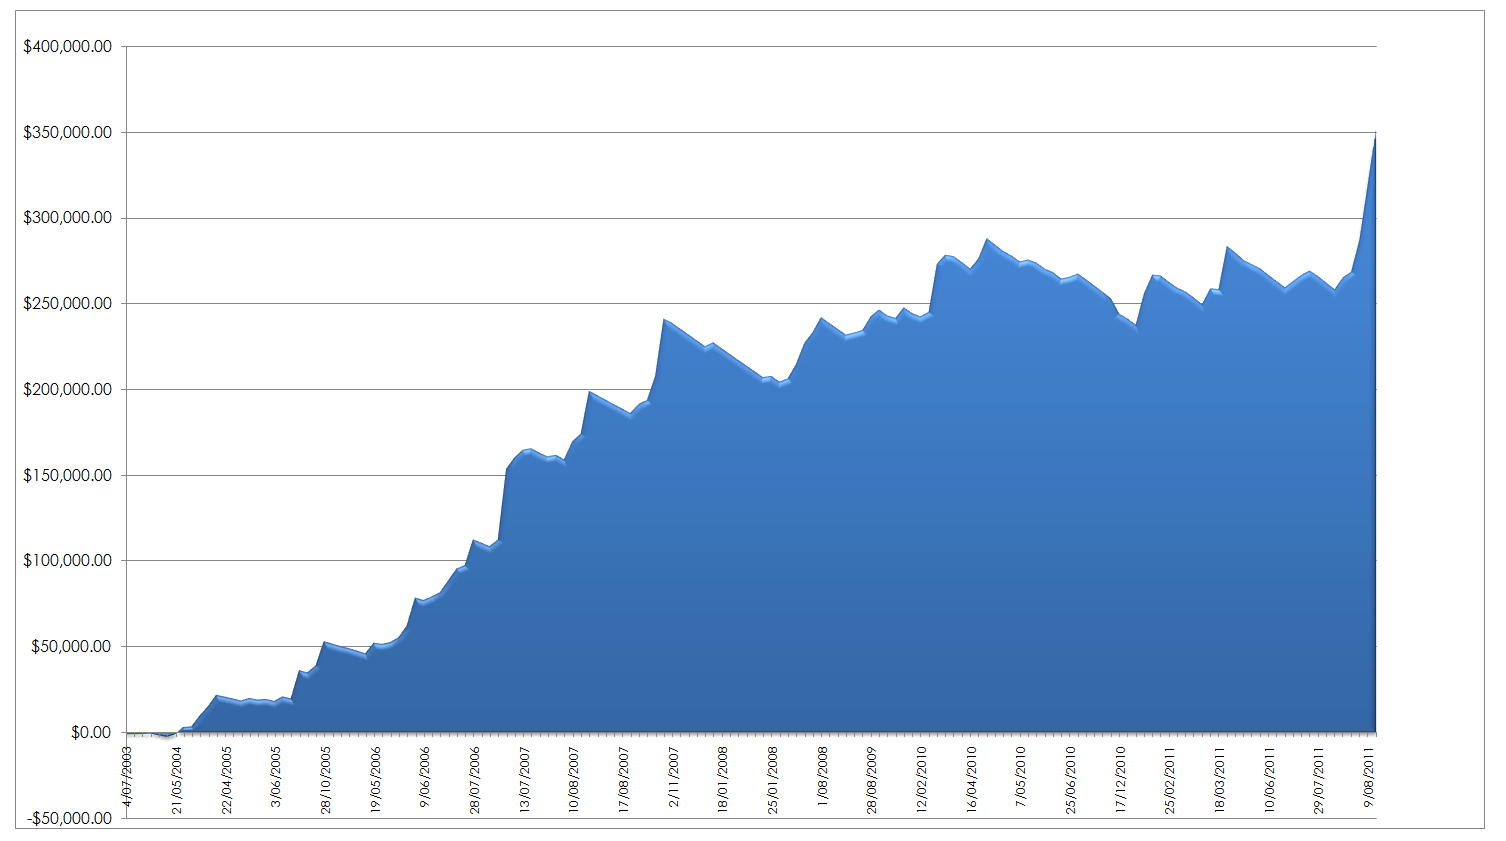
The system returned the following equity curve.
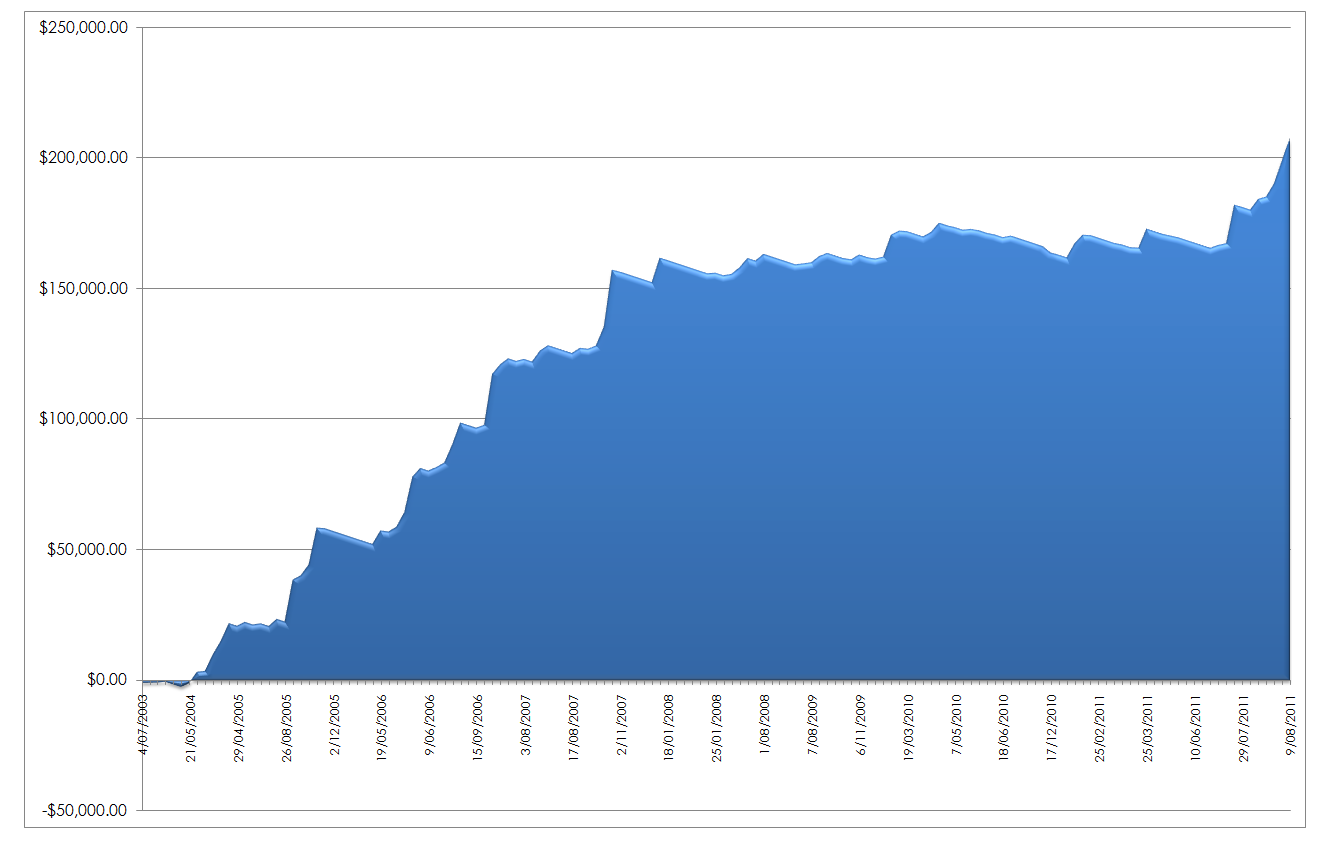
It is important to understand that equity curves are not linear – equity does not grow in a straight line but rather is bumpy as winning and losing trades are mixed together.
Monte Carlo Results
In testing a system it is important to make certain that the system is truly robust and that the results achieved are not simply dependent upon the order in which the trades were taken. This is done by what is known as a Monte Carlo analysis which reorders the results to see what happens if trades are taken in a different order. In simple terms Monte Carlo analysis makes certain that you simply did not get lucky.
| Monte Carlo Profit Stats |
| Maximum Profit: |
$289,398.01
|
289.40%
|
| Average Profit: |
$192,954.95
|
192.95%
|
| Minimum Profit: |
$106,821.31
|
106.82%
|
| Standard Deviation: |
$24,739.17
|
24.74%
|
| Probability of Profit: |
100.00%
|
| Probability of Loss: |
0.00%
|
What these statistics show is that even if the system took the worst performing trades it was still profitable with a 0% chance of being a losing system.
It is possible to take a robust system and make gradual improvements to it through money management. In this instance we added simple pyramiding to the system to observe the difference if any in results.
Key Results Summary
| No Pyramiding |
Pyramiding |
| Profit Status: |
PROFITABLE
|
PROFITABLE
|
| Starting Capital: |
$100,000.00
|
$100,000.00
|
| Finishing Capital: |
$307,491.63
|
$451,800.04
|
| Maximum Equity |
$207,491.63
|
$351,800.04
|
| Minimum Equity |
-$2,536.91
|
-$2,536.91
|
| Largest Winning Trade: |
$21,759.84
|
$41,209.23
|
| Largest Losing Trade: |
-$2,458.00
|
-$8,941.25
|
| Average Winning Trade: |
$4,319.81
|
$8,054.73
|
| Average Losing Trade: |
-$916.20
|
-$2,717.11
|
| Average Win/Average Loss: |
4.7149
|
2.9644
|
| Profit Index: |
73.90%
|
61.52%
|
| Annualized Compound Return |
14.54%
|
19.99%
|
As can be seen pyramiding into an existing robust system adds to the profitability of the system. This profitability can be further explored with the following graphs.
The impact of pyramiding versus non pyramiding is shown below.
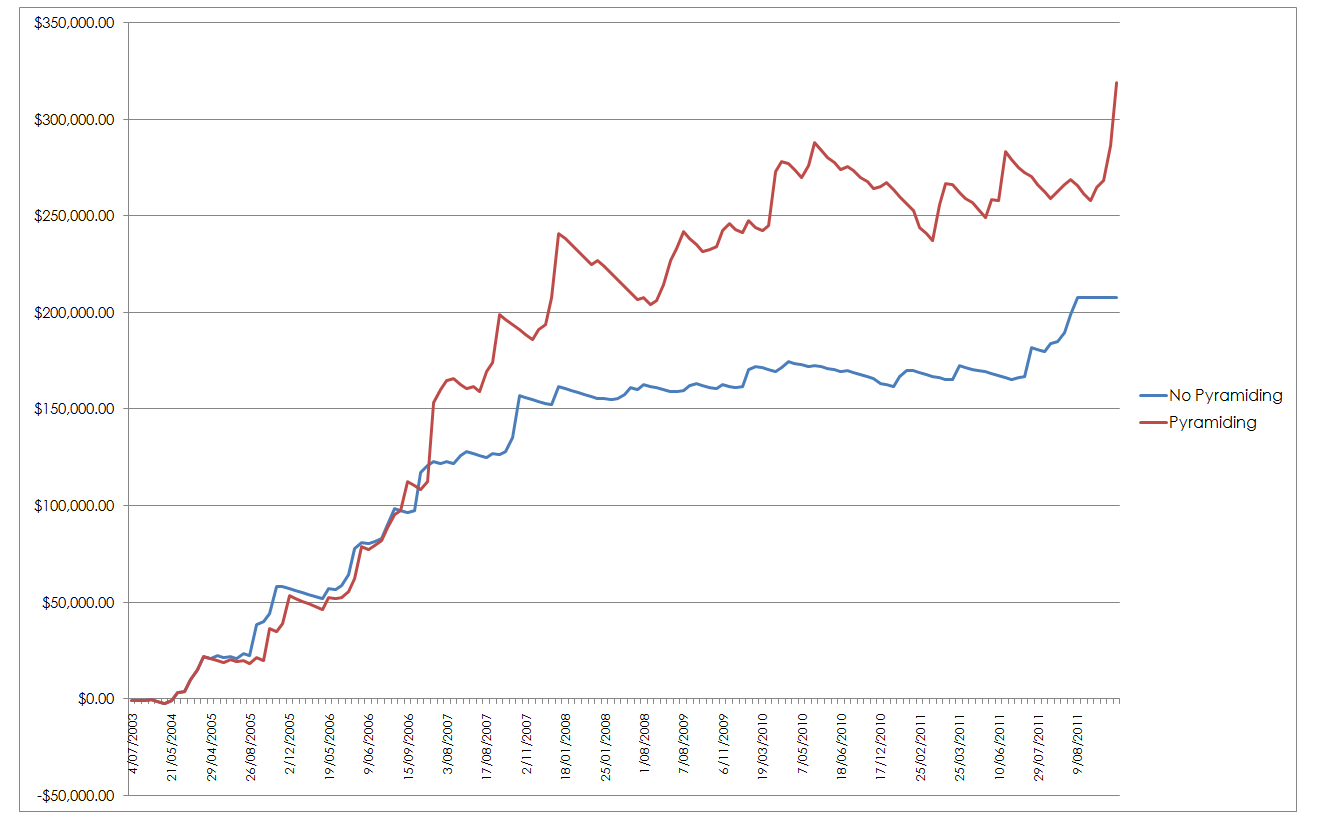
Once again the trajectory of a traders equity in achieving a given result needs to be considered when comparing systems. The chart below shows that the drawdown in the pyramiding system has increased versus the original system.
External Training