Skip to content
Trading Game
Trading Game
Trade Confidently and Safely
  • Home
  • About
    • About Louise Bedford
    • About Chris Tate
    • Chris Tate Media Kit
    • Louise Bedford Media Kit
  • Why Choose Us
    • Audited Results
    • In The Press
  • Mentor Program
  • Rave Reviews
    • More Rave Reviews
    • Even More Rave Reviews
    • Extra Rave Reviews
    • Still More Rave Reviews
    • This Is Getting Ridiculous
    • Success Stories
    • More Success Stories
    • We Are Traders
    • A Poem To Inspire You…
    • Hot Off The Press Reviews
    • You Want Proof?
  • Our Network
    • Our Brokers
  • Shop
  • Blog
  • Contact
  • LOGIN

S&P 500 Day By Day…..

You are here:
  1. Home
  2. Blog
  3. Economy
  4. S&P 500 Day By Day…..

I came across this image on Bespoke – those folks who generate arrays of dazzling data very few of which are in any way helpful to market participants.

Screen Shot 2014-04-22 at 2.35.04 pm
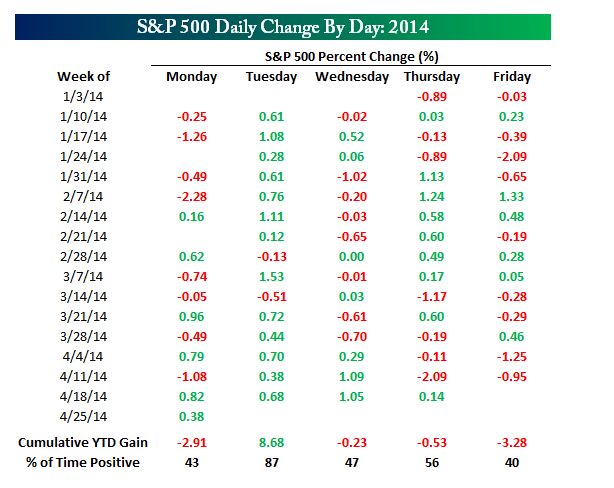
It shows the daily change on the S&P 500 since January and I have no idea why this would be of interest but I thought I would take it further and look at more data. So the chart below looks at the average daily change on the S&P500 going back eight years.

Screen Shot 2014-04-22 at 3.02.23 pm


As you can see adding a little more data presents a different picture, this is to be expected since a few months is a very narrow time frame over which to analyze anything.

The crucial question is does this information tell us anything and the blindingly obvious answer is not a friggen thing and this is the issue with trading news/data very little of it is actually relevant to your decision making. It looks nice and some of it is undoubtedly clever but it doesnt tell you anything and in some ways probably interferes with the trading decision.


Categories: Economy, International MarketsBy Chris TateApril 24, 2014

Post navigation

PreviousPrevious post:Shiller Says `Easy to Beat the Market’ Long TermNextNext post:Surviving Anxiety

Related Posts

Most Important Chart Of 2022
April 21, 2022
Ten Minutes With Tate Market Review
March 7, 2022
Ten Minutes With Tate The Oil Weapon
February 28, 2022
Daniel Drew: Wall Street Villain
February 23, 2022
Trading Game
BACK TO TOP


General Advice Warning

The Trading Game Pty Ltd (ACN: 099 576 253) is an AFSL holder (Licence no: 468163). This information is correct at the time of publishing and may not be reproduced without formal permission. It is of a general nature and does not take into account your objectives, financial situation or needs. Before acting on any of the information you should consider its appropriateness, having regard to your own objectives, financial situation and needs.

Privacy and Licensing | Terms & Conditions | Referrals

  • Home
  • About
  • Why Choose Us
  • Mentor Program
  • Rave Reviews
  • Our Network
  • Blog
  • Shop
  • Contact Us
  • Log In

Copyright © The Trading Game. All Rights Reserved. | website designed by Papdan.com

Social Media: