
Index Correlations Again
I recently posted this table of index price correlations.
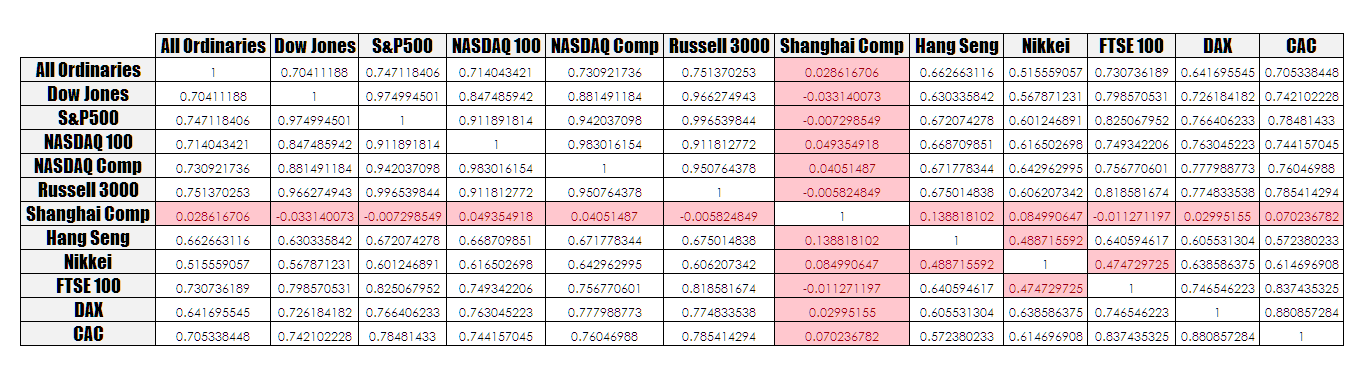
Its a fairly simple table that looks at the degree to which indices follow one another in their general pattern of movement. As you would expect indices that are closely related share a very high correlation. For example the Dow and the S&P500 share a price correlation of 0.97 which is almost perfect. The natural expectation would therefore be that the returns from these two indices would be the same – investing in one would be as good as investing in the other. However, when looking at price correlations things become a little more complicated. The chart below looks at the value of $1 invested in both the Dow and the S&P500 starting just before the GFC hit.
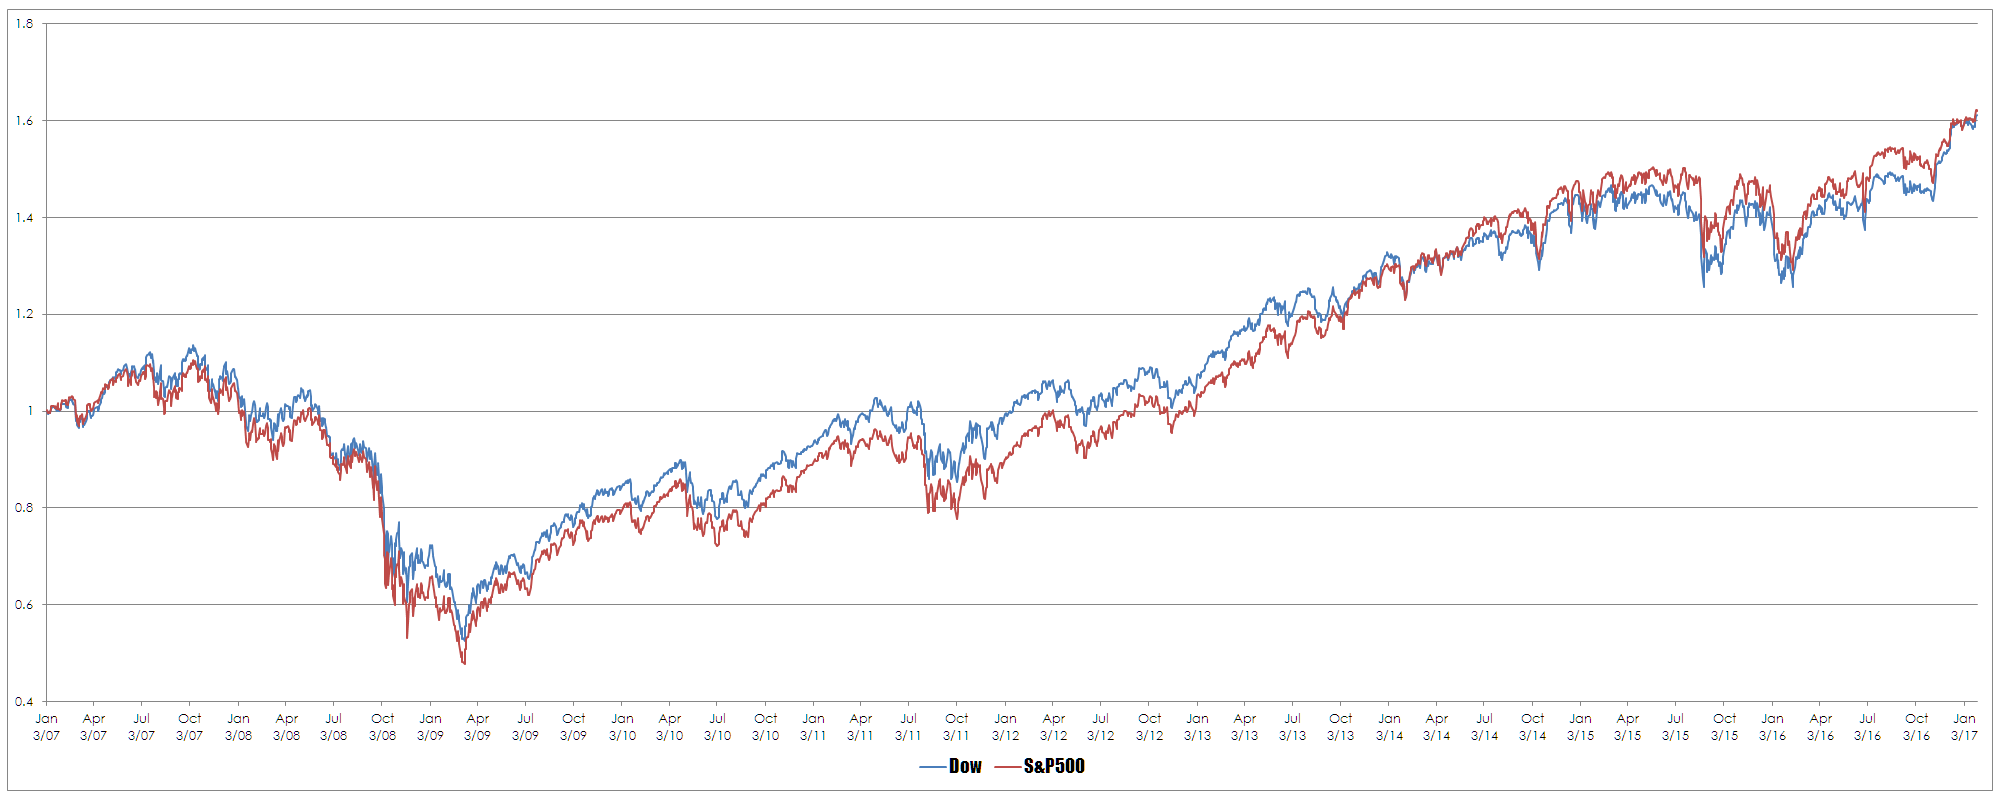
As you can see there is a constant dislocation between the two. Price correlation and return correlation are not the same, in this instance the return correlation is a few points lower. To make matters more complicated all correlations are influenced by the time period you are looking at. The chart below looks at the value of $1 invested in the All Ordinaries and the Dow over the same time period.
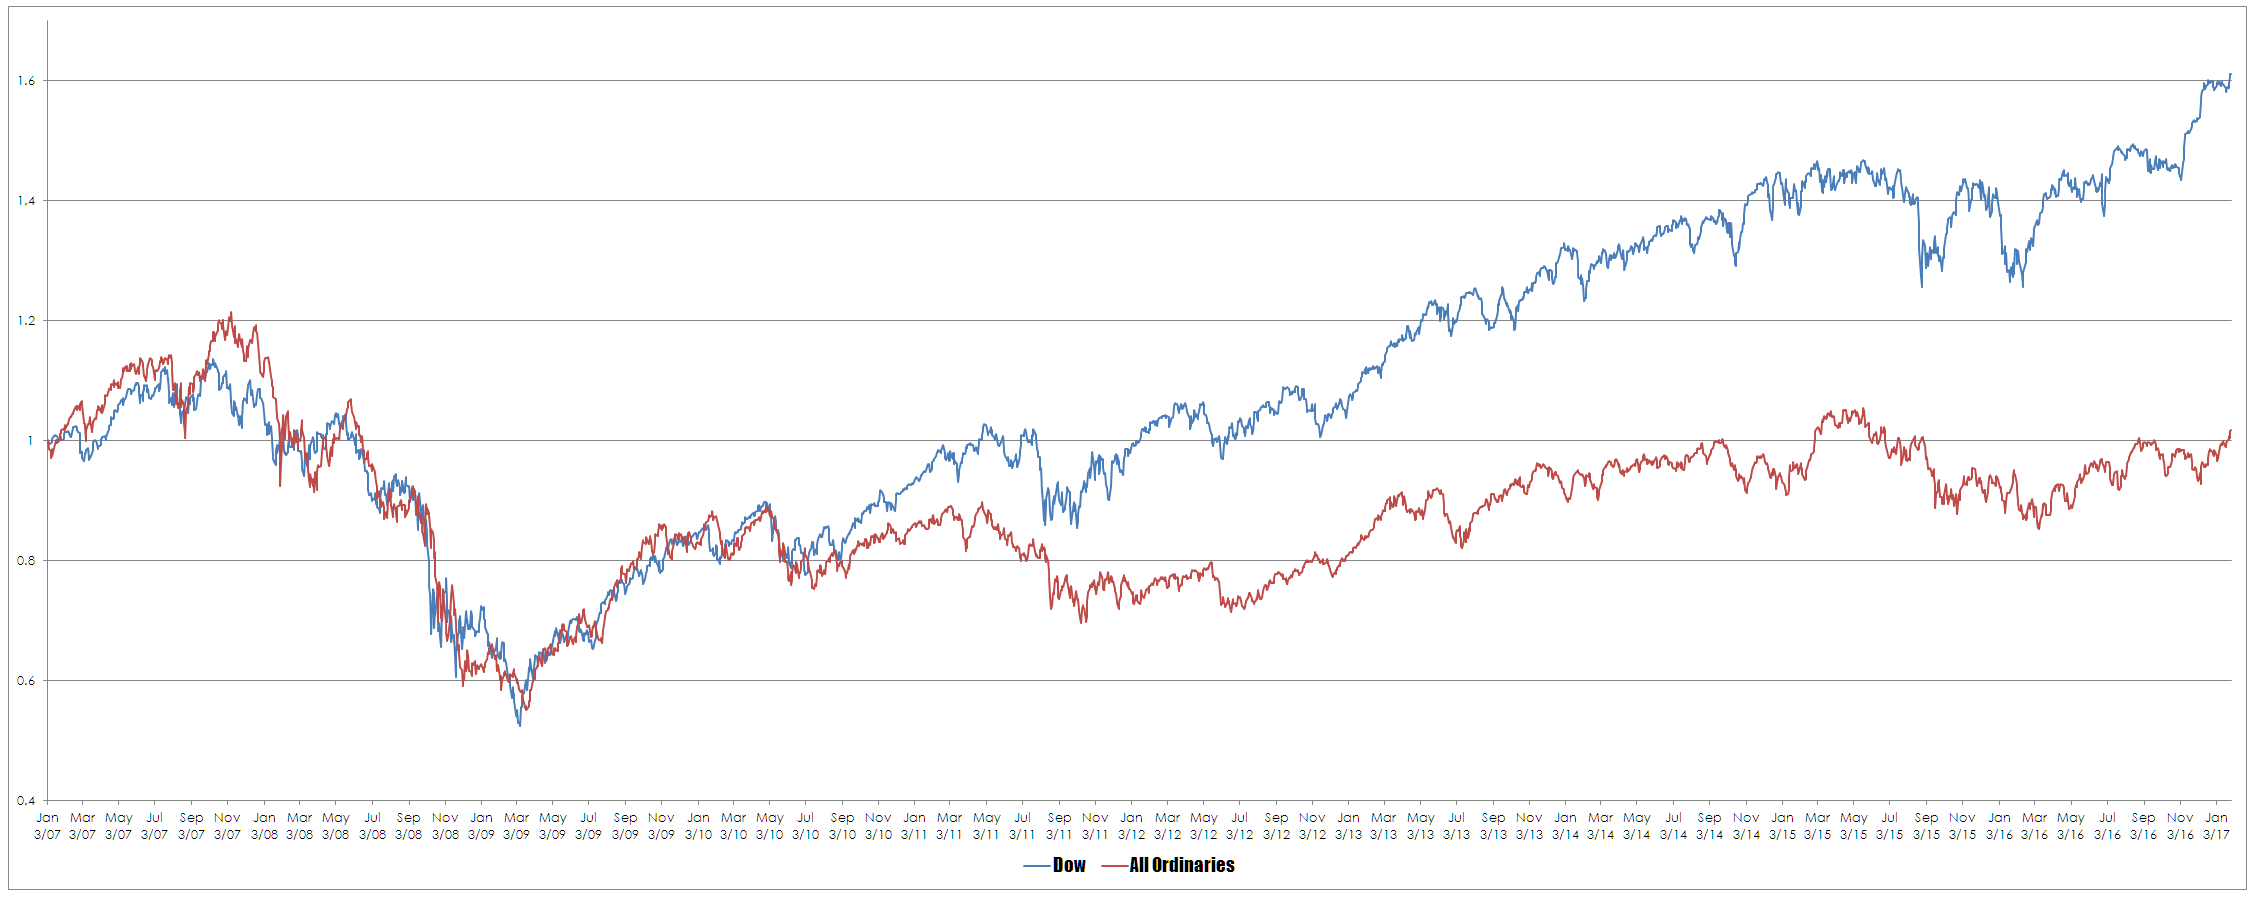
There is a marked difference between the performance of the Dow and the All Ordinaries yet, according to our correlation table the correlation sits at a very high 0.74. What you think you see is not what you get – simply overlaying one price chart over the other would not have highlighted the significance of this difference. But this relationship is affected by the time period selected. The chart below starts much earlier and ends just before the GFC.
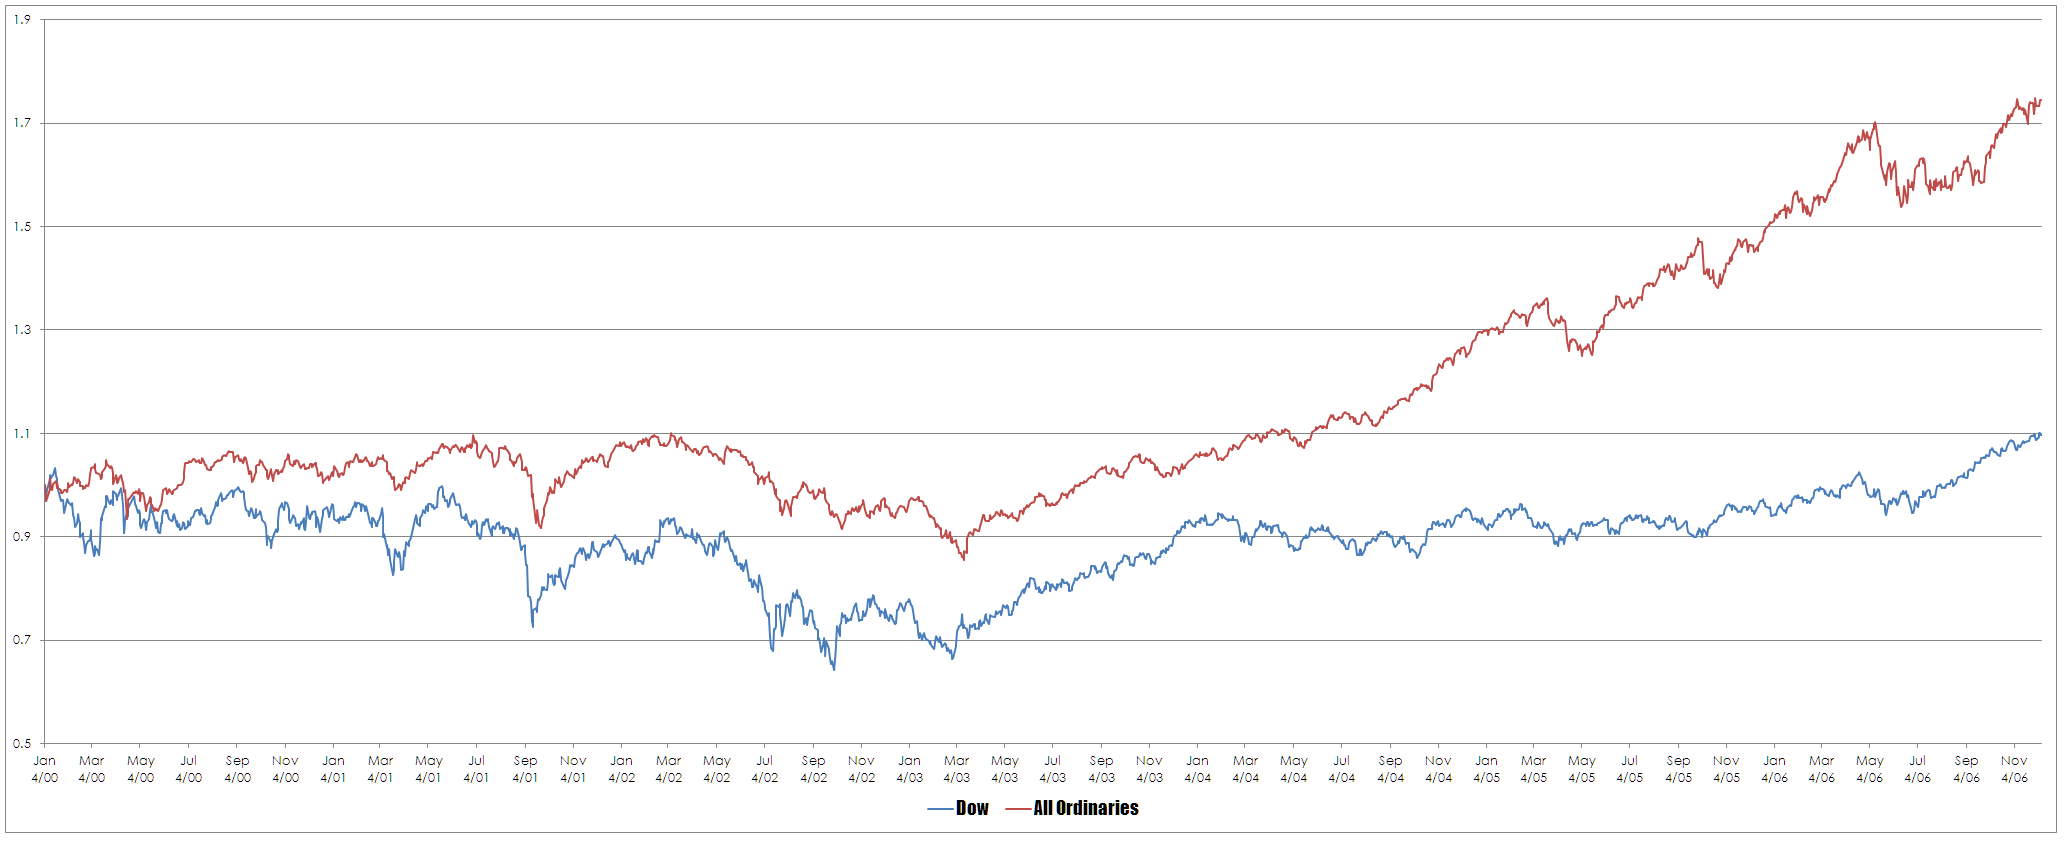
As you can see the situation is reversed with the local market belting the Dow. It is obvious that over different times different markets will display different returns and that this difference is not a function of their price correlation. This presents a series of conundrums for investors in terms of which market to pick to invest in and it also causes problems for the notion of diversification. With regard to the problem of which market to pick this can be solved relatively easily by looking at the relative performance of markets on a regular basis. This is actually quite easy to do since both Yahoo Finance and Google Finance offer a comparison function in their very basic charts.
The notion of diversification is a harder nut to crack. Diversification in the sell side of the industry is based around the idea that if things have different names then you are diversified. But this is a simplistic interpretation as you can see simply by looking at returns. It is possible for instruments to have different names but similar returns and if that return is negative then simply picking instruments on the basis of their name is flawed. To give you an insight into the issues that arise from looking too deeply at diversification consider the table below which looks at the differences in the price and returns correlation for the four major local banks.

As you can see the correlations are strong but quite different. If you were to pose the question as to whether the returns from all the local banks would be the same most would answer yes. Yet this answer would be wrong. In answering the question on diversification I have to admit a personal bias – I do not believe in traditional diversification for the reasons outlined above but also because I operate on a different philosophy. I only have a limited number of good ideas and if those good ideas share similar names then I will probably buy all of them. This as you would expect does introduce volatility into the returns as it sometimes goes wrong but it also sometimes goes right.
This does raise the issue of whether this is more of an academic interest rather than a practical one for traders. The issue of being in the right market at the right time is certainly a practical issue as local stock traders have largely been wasting their time since the GFC. The real gains in equities have been in the US as it has enjoyed one of the largest bull markets in its history whereas we have gone sideways with the occasional burst of short lived excitement. With regard to diversification I am ambivalent.


Thanks Chris.
XJO – strangle or straddle?
With respect to a “big four” index, some will lag and some will lead as far as price is concerned. Returns, one might think will be somewhat determined by core activities and the size of each bank. (Or are you talking investor returns?)
Price is leading returns regardless. Or am I reading it wrong?
Different returns are not a function of price correlations! What! Does this imply a bank is a bank is a bank?
So returns is a function of which way is the trend headed and volatility?
Correlated or not, which ones have the better payoff/time regardless of diversification.