Skip to content
Trading Game
Trading Game
Trade Confidently and Safely
  • Home
  • About
    • About Louise Bedford
    • About Chris Tate
    • Chris Tate Media Kit
    • Louise Bedford Media Kit
  • Podcast
    • Why Choose Us
    • Audited Results
  • Mentor Program
  • Rave Reviews
    • More Rave Reviews
    • Even More Rave Reviews
    • Extra Rave Reviews
    • Still More Rave Reviews
    • This Is Getting Ridiculous
    • Success Stories
    • More Success Stories
    • We Are Traders
    • A Poem To Inspire You…
    • Hot Off The Press Reviews
    • You Want Proof?
  • Our Network
    • Our Brokers
  • Shop
  • Blog
  • Contact
  • LOGIN

Peculiarities Of The Dow

You are here:
  1. Home
  2. Blog
  3. Australian Markets
  4. Peculiarities Of The Dow

One of the intriguing quirks of financial history is that the Dow Jones Index has become the benchmark of the health of the US stockmarket and by extension a metric everyone else is fascinated in.It is interesting that the Dow has become this because of its strange mechanism of calculation and is somewhat anachronistic view of the world. In many ways it is little more than a favourites index or watchlist and this becomes apparent when you look at the quirks in its construction. If you look at the S&P/ASX 20 you see that it is what is known as a capitalisation index – that is the biggest companies have the most heft within the index. If you look at the table below you can see the market capitalisation of its components along with their weighting within the index.

20

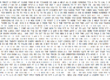
In this sort of index size counts but that is not the way the Dow works. Below are the relative market caps of the Dow components.

market cap

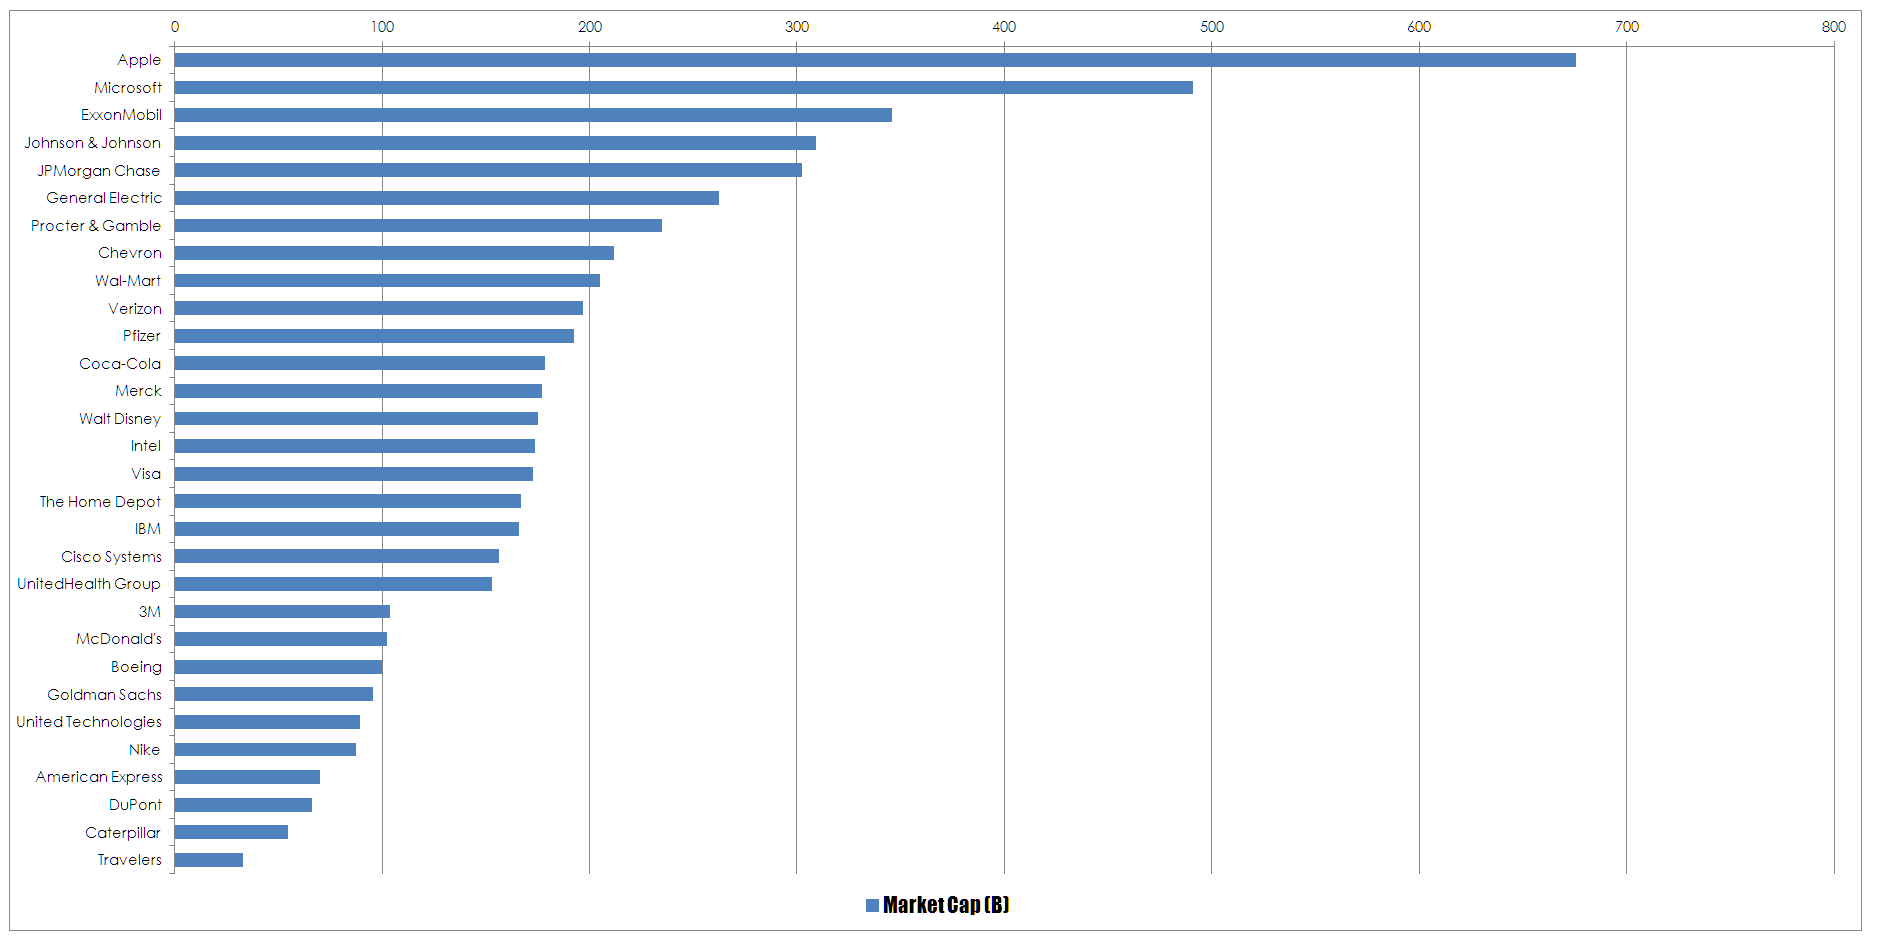
You can see that Apple with a market capitalisation of $675 billion dwarfs everyone else – it is simply enormous. However, something odd happens when you graph the weightings of the components.

% weighting

Goldman Sachs with a market capitalisation of only $95 billion makes up almost 8% of the index compared to Apples 4.45%. So a stock with a market capitalisation that is 14% that of Apple has a weighting just short of twice that of Apple. It is an odd thing when history overtakes common sense.


Categories: Australian Markets, Economy, International MarketsBy Chris TateFebruary 4, 2017

Post navigation

PreviousPrevious post:Peter Gabriel On MusicNextNext post:Why It’s Good To Be Wrong

Related Posts

Where Does Inflation Come From?
June 26, 2022
Ten Minutes With Tate Where Do Returns Come From?
June 22, 2022
Clarke and Dawe – The Energy Market Explained
June 17, 2022
The Halo Effect: Bad Forecasts by Billionaires
June 7, 2022
Trading Game
BACK TO TOP


General Advice Warning

The Trading Game Pty Ltd (ACN: 099 576 253) is an AFSL holder (Licence no: 468163). This information is correct at the time of publishing and may not be reproduced without formal permission. It is of a general nature and does not take into account your objectives, financial situation or needs. Before acting on any of the information you should consider its appropriateness, having regard to your own objectives, financial situation and needs.

Privacy and Licensing | Terms & Conditions | Referrals

  • Home
  • About
  • Why Choose Us
  • Mentor Program
  • Rave Reviews
  • Our Network
  • Blog
  • Shop
  • Contact Us
  • Log In

Copyright © The Trading Game. All Rights Reserved. | website designed by Papdan.com

Social Media: