Context Matters
When I generated this piece on Monday, I left something important out. I looked only at absolute numbers, not at the broader context in which the move occurred.
My simple question was What happens after a large down day? While useful, this framing treats all declines as identical events and ignores the broader environment within which they occur.
A 4% decline in the NASDAQ 100 or a 2.6% decline in the S&P 500 is assumed to have the same implications, regardless of the market’s internal conditions at the time. In reality, markets possess an internal structure that is invisible when viewed solely through the lens of an index chart. An index can decline sharply while the majority of constituent stocks remain healthy. Equally, an index can decline sharply after months of internal deterioration that has already weakened the broader market.
To overcome the limitations of my first look at down days, I have included market breadth data — specifically, the percentage of constituent stocks trading above their 200-day moving average at the time of the decline. I have done this to see whether the market’s internal health influences subsequent returns.
Many data providers offer the capacity to chart the percentage of stocks above or below a given moving average. When you do this, you end up with a chart like the one below.
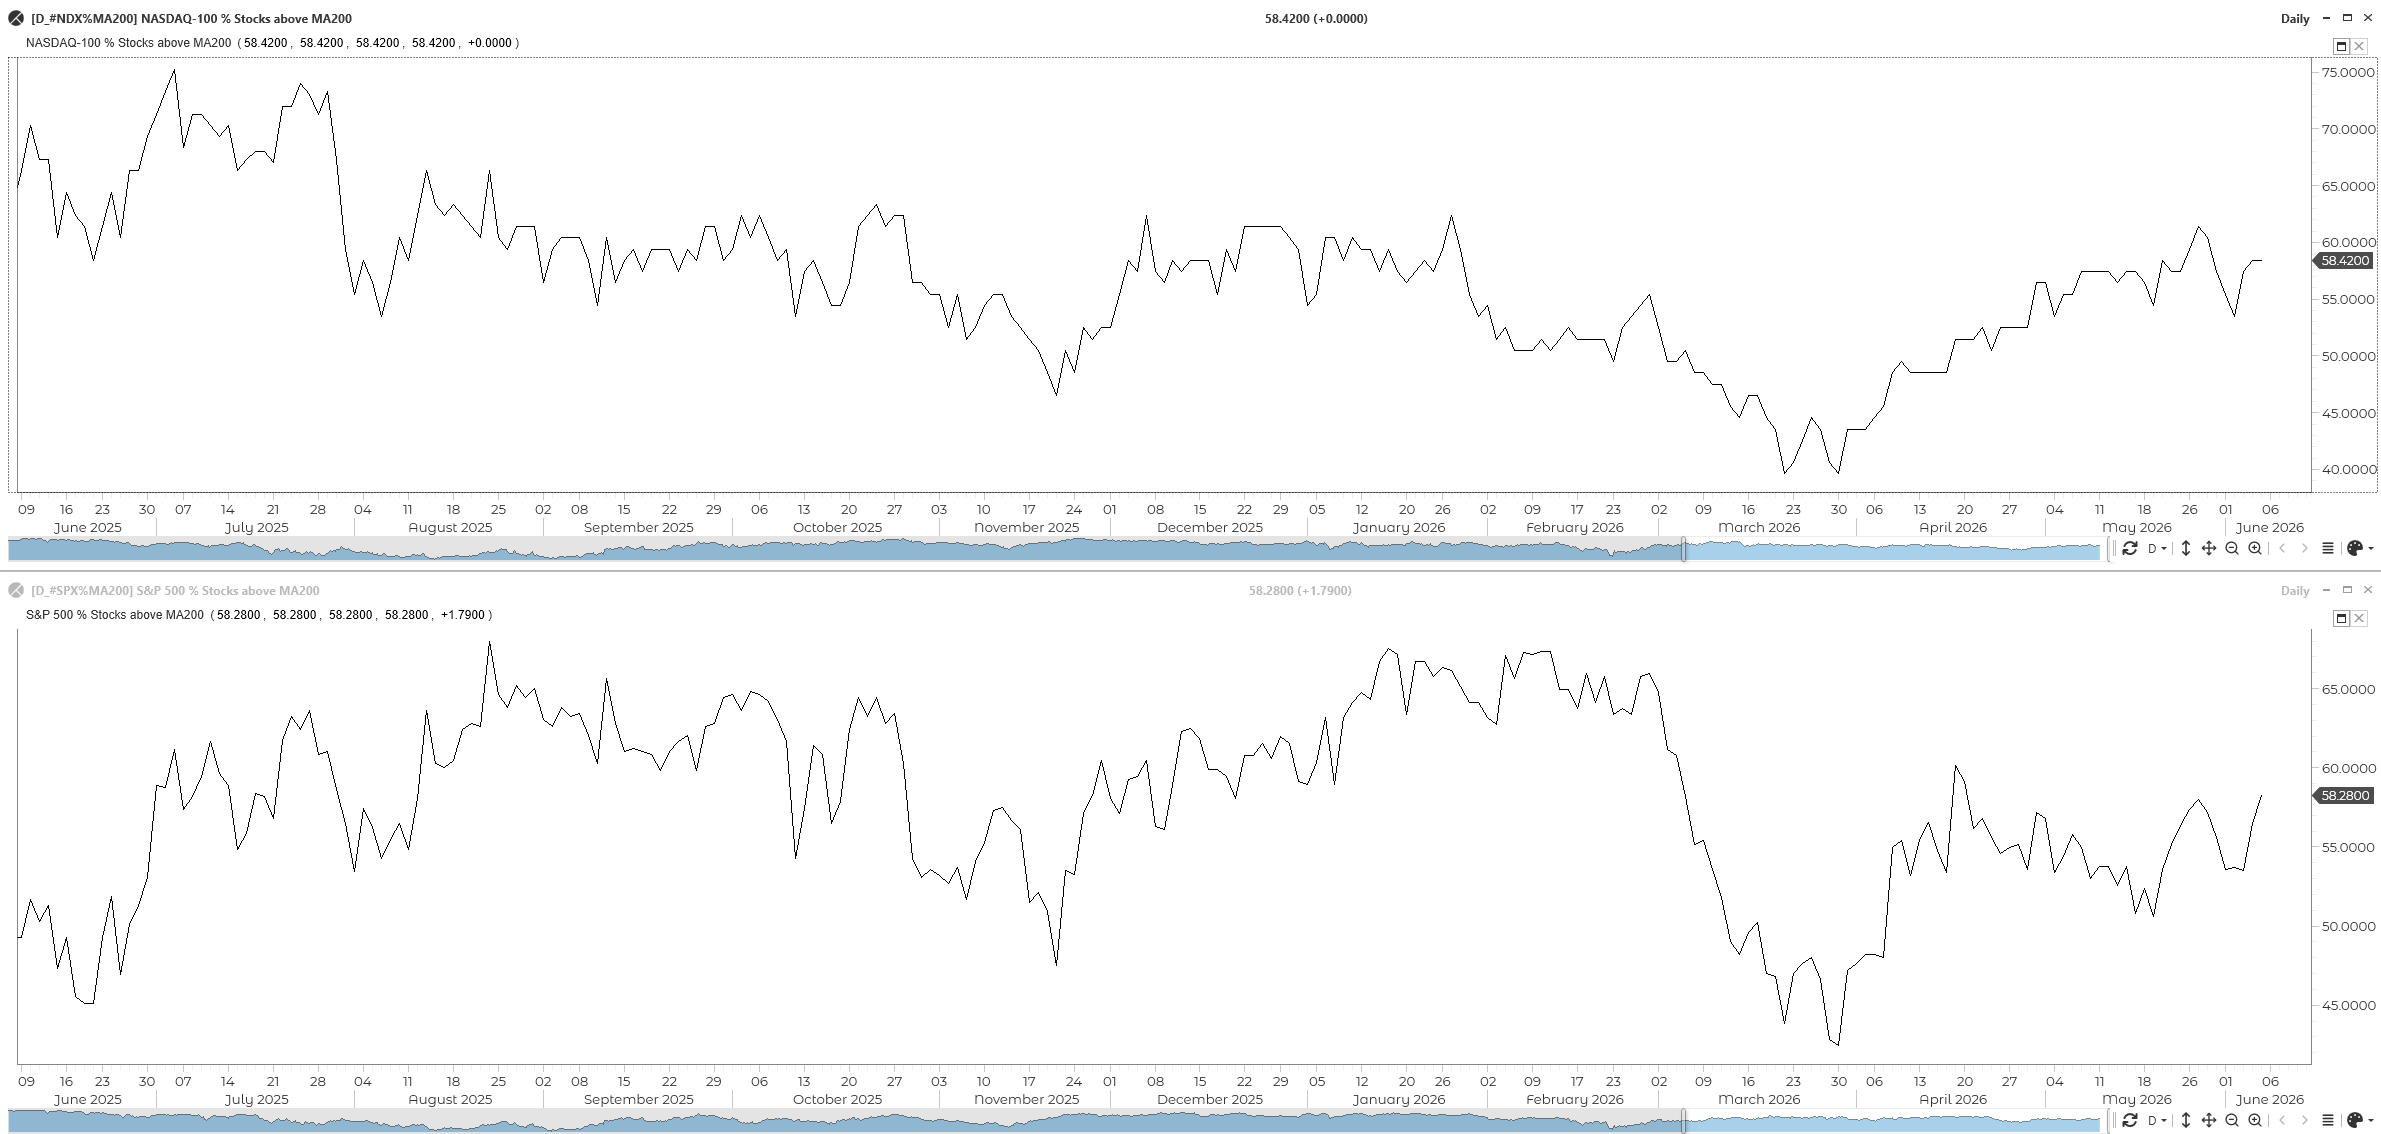
There is a tendency to misinterpret what these metrics mean – traders try to use them as timing tools, which is not their function. They act simply to give you an idea of the internal dynamics of the market. When viewing them, you always have to keep in the back of your mind that indices are constructed from an aggregation of differently weighted elements. You can have the majority of stocks going down, as evidenced by this sort of chart, but the index may still be going up. This is simply a function of their weighting.
Understanding Breadth
Traditionally, when viewing this chart, there are standard interpretations, as shown in the table below.
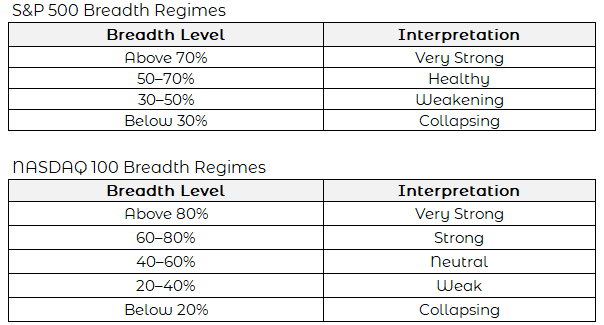
Conventional Expectations
Intuitively, it seems obvious that strong breadth should produce stronger future returns following a large decline. A market in which the majority of stocks remain above their long-term moving averages possesses a structurally sound foundation.
When a shock occurs, the market’s underlying health should enable a more rapid and sustainable recovery.
Conversely, weak breadth should lead to lower future returns. A market in which participation has already narrowed significantly is fragile. Leadership is concentrated. Internal deterioration has already begun. When a large decline occurs in this environment, the damage extends further, and the recovery is slower and less reliable.
This all seems somewhat obvious. Healthy internals produce better outcomes. Deteriorating internals produce worse outcomes. The data, however, tells a significantly more nuanced — and in some respects, counterintuitive story. The relationship between breadth and forward returns following large declines does not follow the simple linear pattern most investors would assume.
This nuance did surprise me.
S&P500 Results
The earlier study examined 20-day future returns following a fall of 2.6% or greater, as we saw at the close of last week. So I repeated this, but did so against the backdrop of market breadth.
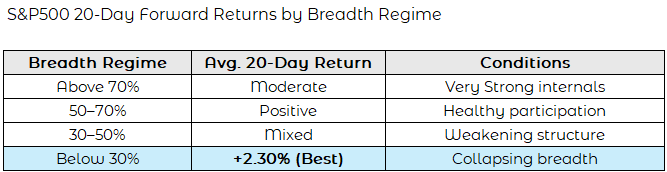
When fewer than 30% of S&P 500 stocks remain above their 200-day moving average, the subsequent 20-day average return has historically been the strongest across all breadth regimes.
This raises the question of why this is so, and it took me a bit of time to think of a plausible explanation for why the weakest market in terms of structural strength produced the largest bounce. My thinking is that when breadth has collapsed, the market is primed for a mean reversion event.
Markets that have broken down internally to this degree are typically characterised by widespread pessimism, significant de-risking across institutional portfolios, forced liquidation, and elevated measures of market fear. Under these conditions, much of the selling pressure has often already been absorbed by the market. The subsequent decline becomes less about deteriorating fundamentals and more about emotional exhaustion. The market becomes technically and psychologically primed for mean reversion. In effect, the strongest opportunities emerge not when conditions are healthy and comfortable — but when pessimism has already become excessive and extreme.
Traders’ emotions have been stretched tight in one direction, and they are looking for a reason to rebound. We see this typically emerge as a v-reversal – the last significant one for indices was during the last round of tariff idiocy. Markets rebounded savagely at the first opportunity.
NASDAQ 100 Results
The NASDAQ 100 produced a different profile. The strongest returns did not emerge from a breadth collapse. Instead, they occurred during a more balanced internal environment — when the market was correcting, but not breaking.
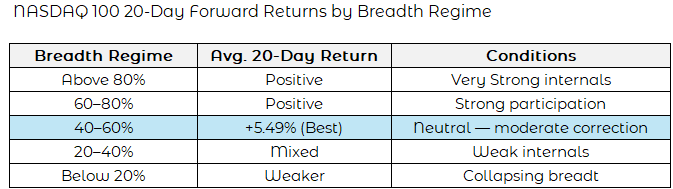
When you begin to look in depth at how indices perform, you get to understand how different they can be. The NASDAQ 100 is fundamentally different from the S&P 500 in its composition. The index is heavily concentrated in growth-oriented technology and innovation companies, where sector leadership often rotates rather than disappears entirely during periods of market stress.
When breadth falls into the 40–60% neutral range, it signals that leadership is being challenged — but not destroyed. Historically, these conditions correspond to corrections within a larger uptrend rather than to the onset of a sustained bear market. These are your archetypal reset trade conditions.
Not All Weakness Is The Same
One of the things this follow-up made me consider was the notion that not all weaknesses are the same. There is what I would call a healthy weakness, with breadth remaining reasonably stable. Leadership rotates across sectors rather than collapsing entirely. Long-term moving average trends remain broadly intact across the constituent universe. What selling pressure there is is corrective in nature.
It is a reset rather than a collapse.
This environment appears more characteristic of the NASDAQ 100. Large declines in this context often represent opportunities, because the broader structural trend remains sound. The selling is technical rather than fundamental. The index corrects. It does not collapse. The mechanism driving subsequent returns is trend correction and mean reversion within an intact uptrend.
This needs to be contrasted with a structural collapse, where the number of stocks below their long-term moving average begins to climb. Participation deteriorates across the board rather than rotating among sectors. Selling becomes widespread, indiscriminate, and increasingly forced. Fear begins to dominate the backdrop to decision-making.
This environment appears more characteristic of the S&P 500 during its most extreme periods of breadth collapse. Paradoxically, it is also the environment in which some of the strongest subsequent rebounds have historically occurred — because expectations have already become excessively pessimistic and positioning has been significantly reduced. The mechanism driving subsequent returns is emotional exhaustion and capitulatory mean reversion.
There Is Always A But
I was mindful that, during this little investigation, particualrly with the NASDAQ 100, we have, for many years, been operating under the aegis of an almost constant bull market. Technology has massively outperformed, and then the index has experienced extraordinary secular growth.
This does make me a little circumspect about the results. Looking at breadth is less fragile than looking at price alone, which I did in the last study, but upward drift may be a problem to look at.
But the overall conclusion that the environment in which a decline occurs carries at least as much predictive weight as the size of the decline itself. A large decline occurring within broadly healthy breadth conditions carries different forward implications than the same decline occurring within a collapsing breadth environment.
Context always matters.