An Observation
Whilst scrolling through ASX listed ETO stocks I noticed something interesting – the performance of the top 20 listed stocks is quite mixed and different to the broader index. The chart below shows the S&P/ASX20 (white) versus the S&P/ASX200 (blue).
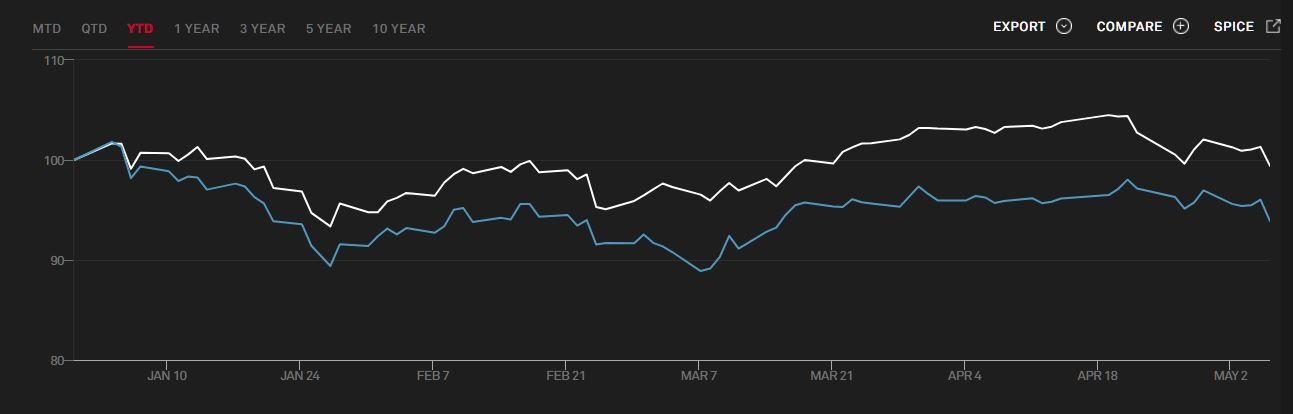 The S&P/ASX20 is down about 0.59% YTD whereas the S&P/ASX200 is down 6.1% YTD. Given how poor markets have been I thought I would investigate this discrepancy a little further so I generated a table of ASX20 stocks and looked at their YTD performance as shown below.
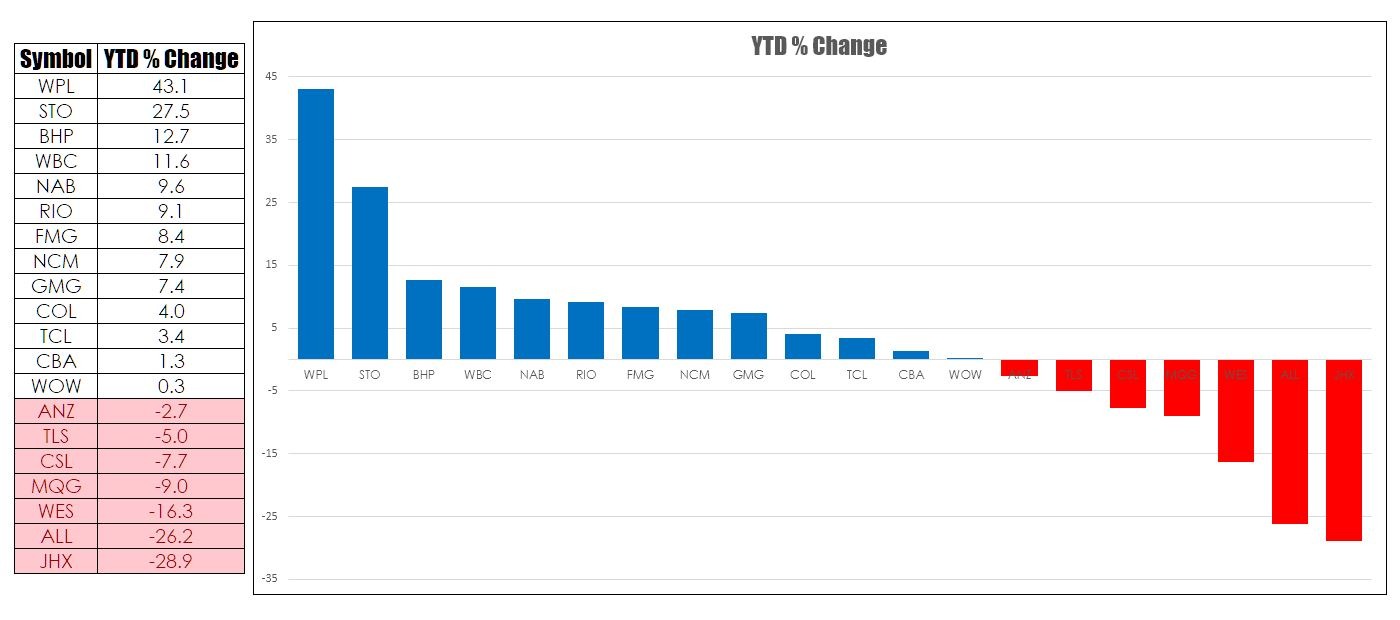 You can see it is a somewhat mixed bag but the heavyweights seem to be holding up reasonably well so far this year. However, in terms of overall index performance, it should be noted that WPL is an outlier generated by corporate action. As such it is not a true reflection of broader market sentiment but rather is being driven by a single idiosyncratic event. Nonetheless, there are more positive stocks than negative which means the fall in the S&P/ASX200 is coming from outside this index which means certain market segments are getting absolutely belted. I make this judgment because the S&P/ASX20 is 80% of the market capitalisation of the S&P/ASX200 and therefore is probably close to 80% of the market’s entire market capitalisation.
The fate of broader indices will be very interesting if the heavyweights decide to start falling.