The Most Reliable Indicator In The World…..Honest
Like my clickbait title?
This piece follows on from last week’s, where I discussed markets hitting new highs and the reluctance of traders to buy at new highs.
 To reiterate culturally, we are raised to value bargains — the notion of getting something “cheap” is equated with prudence and intelligence. Western societies, in particular, celebrate thrift and the illusion of outsmarting the system. This conditioning runs directly counter to the logic of momentum trading, where buying strength is rewarded rather than punished. To most people, paying more than yesterday’s price feels like doing something stupid.
 Evolution compounds this bias. For millennia, survival favoured risk aversion — our ancestors who conserved resources and avoided uncertainty lived longer. This instinctive wiring prompts us to seek safety and comfort in the familiar, rather than chasing what seems distant or “too high.” Loss aversion, a cornerstone of behavioural finance, is an evolutionary echo of that bias: we feel losses twice as intensely as gains.
 Thus, when a market makes a new high, it triggers both cultural and biological alarms — “too expensive,” “too risky,” “due for a fall.” Humans are applying to understand crowd dynamics, and they are even worse statisticians. It is challenging for us to envision a scenario where the crowd’s mood leads to a clustering of results that drives prices beyond our expectations.
Our own entrenched view of the world blinds our capacity to employ variant perception.
The most reliable indicator we have as traders is whether an instrument, regardless of which one, is surpassing its previous highs. All indicators are simply iterations, often many steps removed from this fact.
You are paid on price – nothing else. As such, your first question should be: Has the price moved to a new high? This can be a new all-time high or a new relative reflecting a break from congestion. But it must be moving up.
People ask why we would do this – there is a blindingly simple reason: it works, as shown in the plethora of evidence I presented in the previous article. But I thought I would generate a practical example.
The chart below shows the S&P 500 closing prices, with new highs marked on the chart.
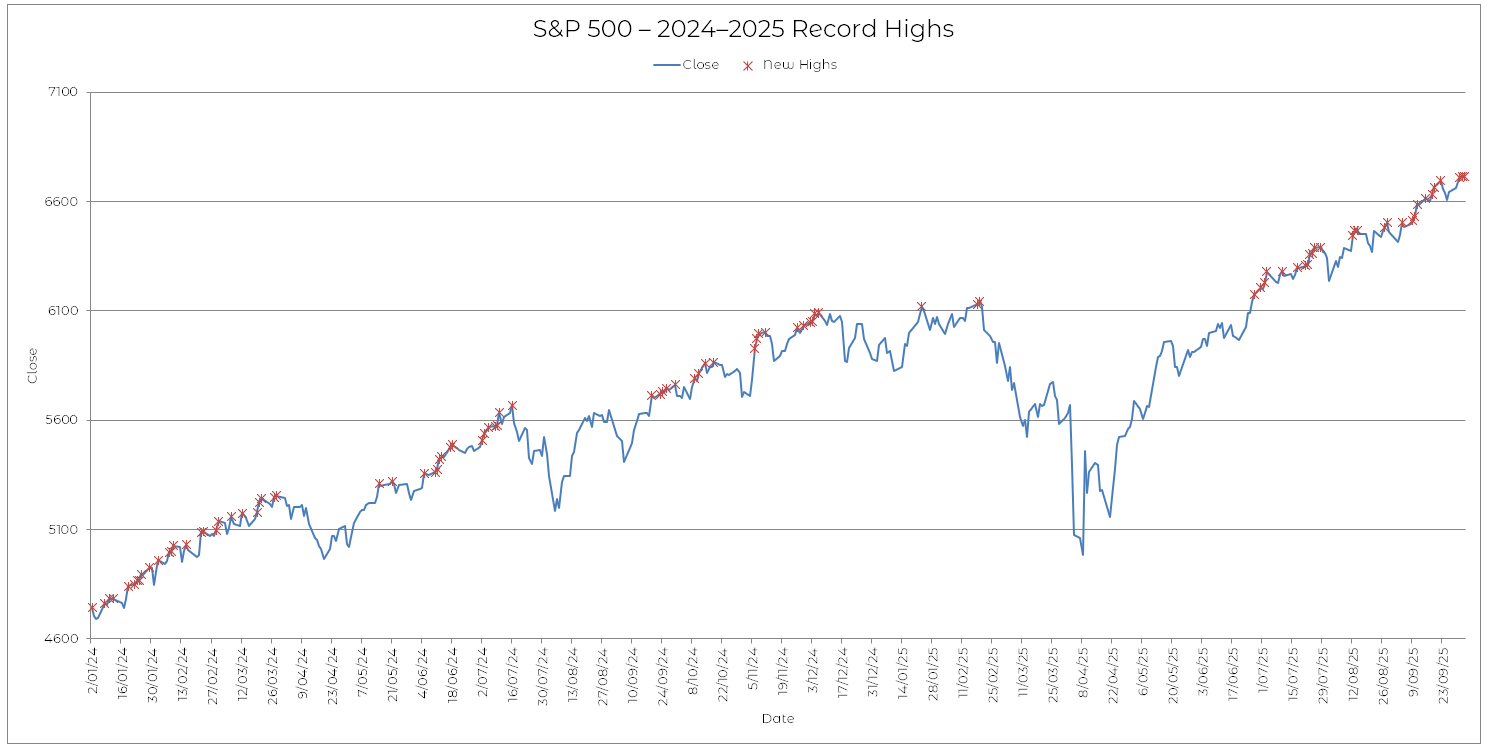 As you can see, it is a profitable strategy.
I thought I would repeat the exercise with EOS, which is one of the better performing ASX stocks of this year.
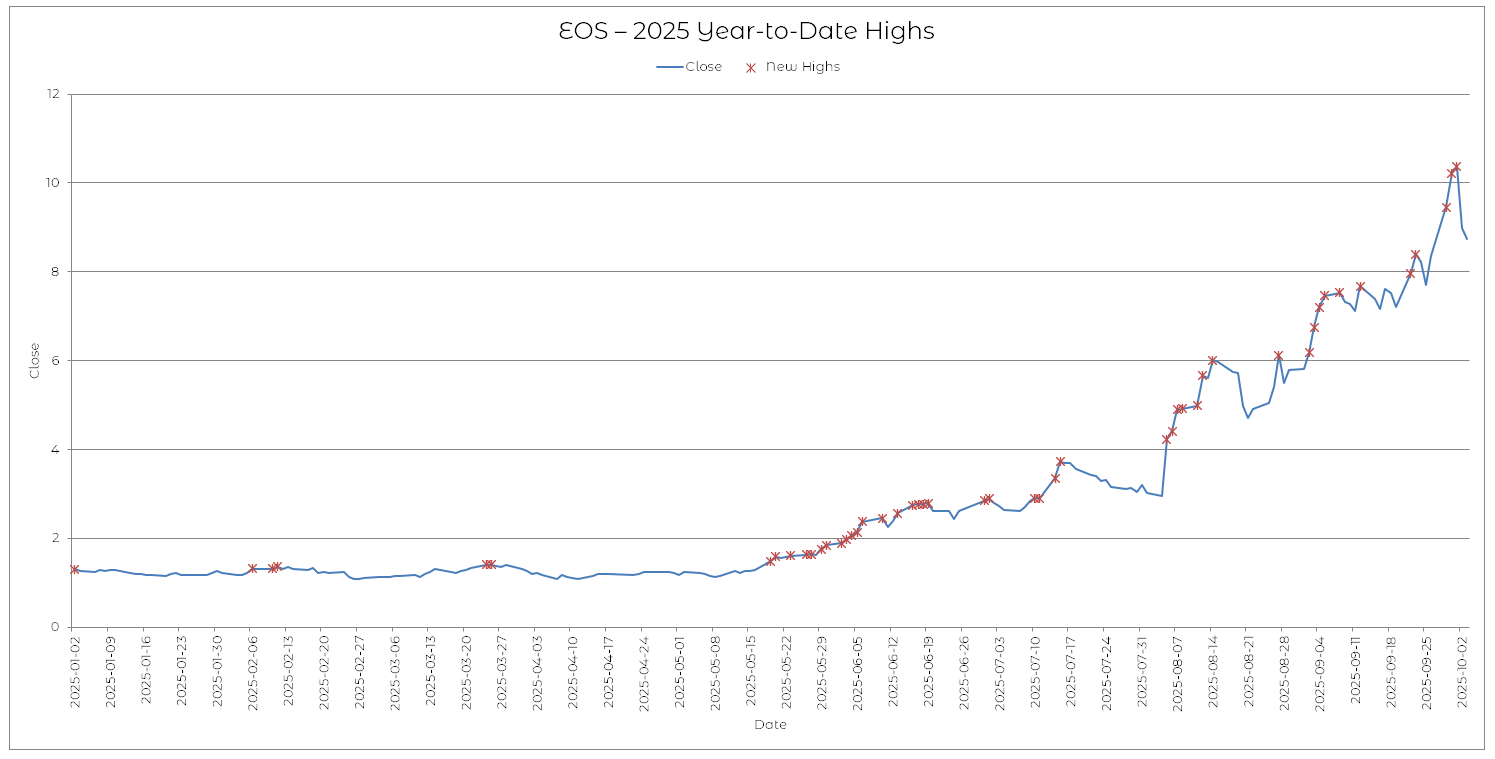 Indicators obscure the truth, whereas price by itself reveals it.
Price will tell you everything you need to know – you need to know how to listen to it.