
Support – Trading
What We’ll Do For You
- Provide cutting edge trading systems
- Give you unlimited support so you can trade with confidence
- Introduce you to other vastly successful traders so you can learn from their methods as well
- Provide you with an unfair advantage in the sharemarket
- Make sure you’re kept up to date with the latest market developments
- Guide you through the array of trading instruments available, so you can make the best possible choice for your personal situation
- Introduce you to contacts that have taken us years to develop, so you can receive the best possible accounting, broking, and trading advice
- Help you to cut through the confusion and find the quickest way to hit the ground running
- Find the quickest way for you to go from zero to hero
What We Won’t Do For You
We won’t abandon you!
Got a question about trading? Then you’re in the right spot. Click on the links below and we’ll set you straight.
1) What does that word mean? Visit our Glossary!
4) How do I track & record my Option Trades?
7) How do I get red & green candles in Metastock tm?
8) What is Relative Strength Comparison?
Free Information about Trading Specifics
1) What does that word mean? Visit our Glossary!
Here is a Glossary file where you can look up those confusing bits of financial jargon that are about to make your head go ‘kaboom’.
![]()
2) What is a Derivative?
Derivatives provide exposure to shares, but they deliver greater leverage. A derivative is a financial instrument that has another asset as its underlying base and includes futures, warrants and options. Rather than purchasing the share (also known as the underlying security), we can trade using a tool that will allow us to make money whatever direction the market is trending. The Trading Game offers a variety of courses to help you trade more profitably using derivatives.
![]()
3) What is an Option?
A call option gives the buyer the right, but not the obligation, to buy a given security at a particular price up to and including the day of expiry. A put option gives the buyer the right to sell a given security at a certain price within a given time. It is possible to either buy to initiate or sell to initiate a transaction. If you sell to initiate, this is called ‘writing’ an option. Buyers’ have rights, but writers’ have obligations
Let’s use call options as an example. The buyer of a call option has the right (not obligation) to buy a given amount of the underlying security, on or before the expiry date, at a specified price. This specified price is called the strike price. The buyer pays a certain amount of money to attain these rights. This amount of money is called the premium. The benefit of trading options in comparison to warrants is that you can either sell to initiate the transaction (ie write an option), or you can buy an option. You can only ever buy a warrant. To write an option results in a much higher probability trade but the potential risk of contingent liability is present. To buy an option limits your risk, but the probability of a winning trade is less.
For more information, refer to The Secret of Writing Options, by Louise Bedford and Understanding Options Trading in Australia, by Chris Tate. For the next scheduled courses on options, refer to the ‘seminars’ page.
![]()
4) How do I track & record my Option Trades?
This is a common problem because option trading can be complex. There is more paper work involved than when trading shares, and careful monitoring of open option positions is essential.
Louise Bedford is the author of The Secret of Candlestick Charting, The Secret of Writing Options and Trading Secrets. She has developed an Excel spreadsheet designed to keep track of written and bought option positions. It shows the option positions that have been taken each month, and tallies up profits on a monthly and yearly basis.
Details about how you can obtain a copy are listed on the ‘Shop’ page under software. Click here for more information.
![]()
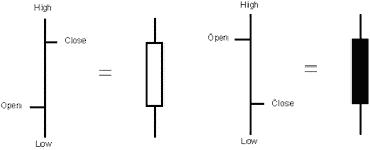
5) What are Candlesticks?
There is a continual tug of war in the market, which displays an imbalance of buyer and seller pressure. Whenever a market is in a state of imbalance, the prices will reflect either a bullish or a bearish sentiment. A single candlestick represents the same data that you will find in a single bar from a bar chart, however they look completely different. The thin lines above and below the real body of the candlestick are called the wicks, shadows or tails (regardless of on which side of the real body they are located). The upper shadow is the high for that period, and the lower shadow is the low for that period. The shadows are usually considered to be of less importance than the thick part of the candle, as they represent extraneous price fluctuations. They provide an indication about the extremes of emotion experienced by the bulls and the bears throughout that period. The thick part of the candle is called the real body and represents the open and the close. These are the most emotionally charged points of the day. The colour of the candle depicts whether the period was bullish (white or green) or bearish (filled in or red). Candlestick charts represent incredible signals that are not available via any other charting format.
For more information, refer to The Secret of Candlestick Charting, by Louise Bedford.
![]()
6) What courses do you run?
![]()
7) How do I get red & green candles in Metastock?
The following instructions show you how to set up red and green candles for your charts.In MetaStock, the Candlestick charts show the candles as black and white by default. The Up candles, where the close is greater than the open are coloured white and the Down candles, where the close is less than or equal to the open are coloured black.

Now whilst this is quite acceptable, there is also a general pseudo ‘standard’ that has Up days green and Down days red.
In MetaStock there is some colour selection available through the price plot properties box, but the colour relationship is based solely on the closing price i.e. the Up and Down colour selections apply to the closing price only, from one period to the next. So for example, if you set the colours as Green for Up and Red for Down, you might be surprised at the result.
You actually end up with FOUR different types of candles – and you only wanted TWO!
These are the possibilities:
1. An Open Green candle – the Close is above the Open and the Close today is higher than yesterday’s Close
2. An Open Red candle – the Close is above the Open but the Close today is lower than yesterday’s Close
3. A Solid Green candle – the Close is below the Open but the Close today is above yesterday’s Close
4. A Solid Red candle – the Close is below the Open and the Close today is below yesterday’s Close
So in this case:
‘A’ – the Candle is coloured Red or Green depending on the relationship of today’s Close with yesterday’s Close. If the Close is higher, then the Candle is Green, if the Close is lower, then the Candle is Red.
AND
‘B’ – the Candle is Solid if the Close is below the Open and Open (unfilled) if the Close is above the Open.
All clear – well I hope so!
Anyway, this is different to the way we really want our Candlesticks coloured. Normally, we only want to know if the Close is above or below the Open (part ‘B’ above).
Well the good news is that there is a way to get MetaStock to emulate this much sort after colour scheme using the ‘Expert Advisor’. We won’t be going into any detail about the Experts, except to give you a step-by-step guide to program this Candlestick colouring example.
1. Click on the Expert Advisor icon (the little man who looks like Charlie Chaplin!)

Or select the ‘Expert Advisor…’ from the ‘Tools’ drop down menu
You are now at the main Expert Advisor window.
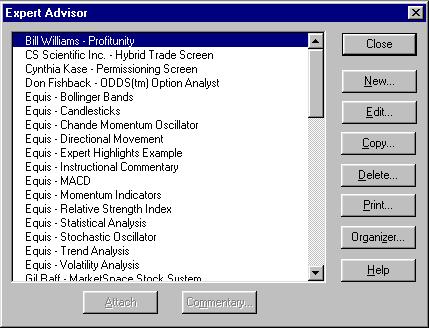
2. To create our new expert, click the ‘New…’ button.
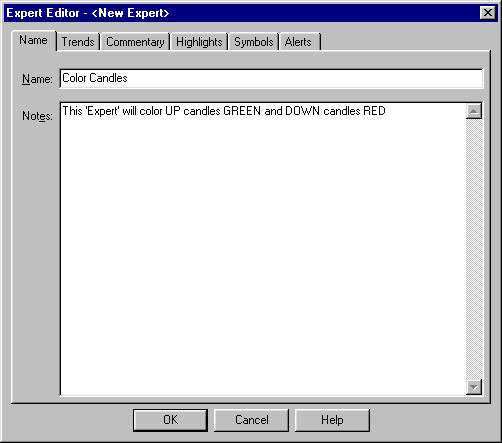
This brings up the Expert Editor. Here you can give the Expert a name, something like ‘Candlestick Colours’ and also add some comments so you know what it does. Like this:
3. Now select the ‘Highlights’ Tab
Select ‘New’ to create a new highlight!
Complete the details as per the following:
You can use whatever colour you want – I selected Dark Green.
Please note that the O is an O as in Open!!
Click ‘OK’.
You are now ready to enter the second highlight (for Down candles – the unhappy ones!!!)
4. Click ‘New’ and complete the second highlight as follows, again you can use any colour you like:
Please note that the O is an O as in Open!!
5. To finish again, click ‘OK’.
You should now have something that looks like this:
6. Click ‘OK’ to return to the main Expert Advisor window.
Create a new chart or open and existing chart or Smart Chart, Right Click on the main chart window to bring up the right click short cut menu. From here select ‘Expert Advisor’ and then ‘Attach…’. This brings up the ‘Attach Expert’ box – select the Candle colouring expert or whatever you called the Expert and click the ‘OK’ button.
Your chart will then be coloured, Green bars or open candles where the Close is above the Open and Red bars or solid candles for when the Close is below the Open – make sure your chart is set to the Candlestick variety to get the best effect.
If you attach the Expert to a Smart Chart, then it will be saved with the Smart Chart, so each time you look at it, the candles will be nicely coloured. If you attach the Expert to a chart, you will be prompted to save the changes.
Experts can be included in templates too, so you might create a template that changes a chart to a weekly candlestick chart, colours the candles with the Expert and plots a 30 period exponential moving average.
To detach an Expert, right click on the main chart Window and select ‘Detach’ from the ‘Expert Advisor’ menu.
![]()
8) What is Relative Strength Comparison?
The relative strength comparison (RSC) is a concept that is often confused with the relative strength indicator (RSI). The RSI is a momentum indicator. Alternatively, the relative strength comparison is a rarely discussed method. This does not lessen its power.
The relative strength comparison takes the progression in price of one instrument and compares it to another. In Technical Analysis Explained, Martin Pring states that:
“Relative strength is a very important technical concept which measures the relationship between two financial series… Relative strength is therefore a very powerful concept for individual stock selection”.
John J. Murphy states in The Visual Investor that:
“Relative strength is an extremely simple but powerful concept. ….savvy investors have learned to move money into hot sectors and out of those cooling off. In this constant search for tomorrow’s leaders and laggards, relative strength is the driving force.”< div>
My own trading has certainly benefited from this concept. A share may be trending upwards, but in comparison to the All Ordinaries Index, it may not have been performing as well as the other shares represented. This would suggest that a different share might represent a more appropriate instrument to purchase. However, if the share in question displayed a positive relative strength in comparison to the All Ordinaries Index, this would be a bullish sign. This share would have, in effect, been outperforming the index.I am aiming to identify shares that have been outperforming their sector, in sectors that have been outperforming the All Ordinaries Index. It is these little gems that I am seeking to isolate, and enter based on a candlestick pattern and a favourable combination of other bullish indicators.Gary Stone is the Director of Share Wealth Systems Investment Services. He advocates the use of the relative strength comparison and has been a key promoter of this technique in Australia. In the next few paragraphs, Gary explains how to use this type of analysis. He states that:The “RSC is a tool that lends itself very well to using a computer to search for the high probability trades in a given market. Two methods can be used to achieve this – top down analysis and bottom up analysis.
Top Down Analysis
Top Down Analysis involves using the RSC to relatively compare each Sector Index with the overall market average, eg the All Ordinaries Index. This will lead the investor to the sectors that have the most positive market sentiment. Once these Sectors have been identified, the next step is to find the stocks in those sectors that are outperforming their respective Sector Index. Using the RSC to compare each stock in the sector to its corresponding Sector Index does this.
To be carried out effectively, Top Down Analysis requires the software to contain a database with a sequential listing of the Indices that represent the sectors of the market, and for all of the stocks in the market to be allocated to their respective sectors.
Bottom Up Analysis
Bottom Up Analysis involves using the power of the computer to search for shares that are outperforming the All Ordinaries Index, regardless of which market sector they belong to. This list of shares can be viewed to seek entry signals using other technical indicators such as candlesticks, momentum indicators and volume.”
Bottom Up Analysis requires a software product that has an “A to Z database”.
Gary cautions that:
“As powerful as RSC analysis is, it will only identify which stocks to focus on, not when to enter. It should, therefore, always be used in conjunction with other indicators to determine when to enter the trade.”
Louise Bedford states: “For more information on how I specifically apply RSC to my trading, refer to The Secret of Candlestick Charting, and Trading Secrets.
![]()
9) What is Short Selling?
Usually when we buy a share, we are hoping to buy it at $5.00 for example, and sell it at $10.00 at a later date. Short-selling performs this same process, but in reverse. In effect, you borrow shares that you do not own, sell them with the expectation that the share price will drop, then buy them back at a later date. Your profit or loss is the difference between your sell price, and your buy price – so if the share price drops, you make a profit. If the price increases, you will incur a loss. It is actually quite a simple concept, yet less than 1% of transactions in Australia are executed utilising this method.
![]()
10) How do I formulate a Trading Plan?
A Trading Plan is a business plan that will help guide your trading decisions. There are four components that you need to record in your trading diary, prior to entering a new position:
- Entry Requirements
- Profit Taking Methodology
- Stop Loss Procedures
- Position Sizing
Your trading plan should be reviewed on a frequent basis to ensure that your system is in line with your current objectives. Short-term traders should review this process every month. If you are a medium-term or longer-term trader, every 3 – 6 months should suffice.
It is essential that your plan blends in with your lifestyle and personality. No two traders, and therefore trading plans, are the same. This is your blueprint for success – no one else’s.
To obtain a free copy of a Trading Plan Review written by Louise Bedford, click here.
![]()
11) What books should I read?
Books are one of the best sources of education regarding trading. The ‘Shop’ section of this website will list a large array of books to choose from that you can order online. Sometimes it’s difficult to know exactly which book will suit your level of experience. Here is a guide to assist:
Introductory – Intermediate Books
Bedford, Louise Trading Secrets, Wrightbooks, July 2001
Bedford, Louise The Secret of Candlestick Charting, Wrightbooks, Reprint 2001.
Tate, Chris, The Art of Trading, 2nd Edition, Wrightbooks, 2001
Weinstein, Stan, Secrets for Profiting in Bull and Bear Markets, Irwin Professional Publishing, 1988
Books on Trading Options and Downtrends
Bedford, Louise, The Secret of Writing Options, Wrightbooks, Reprint 2000.
Tate, Chris, Taming The Bear, Wrightbooks, 1999
Tate, Chris, The Art of Options Trading in Australia, Wrightbooks – A Division of Wiley, 2002
![]()